by Don Vialoux, Timingthemarket.ca
Editor’s Note: Mr. Vialoux is scheduled to appear on BNN today at 7:45 AM EST
StockTwits Released Yesterday @EquityClock
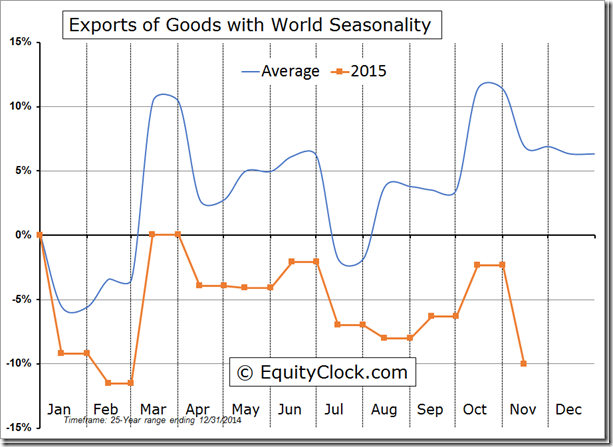
Weakness in U.S. exports on pace to continue into 2016
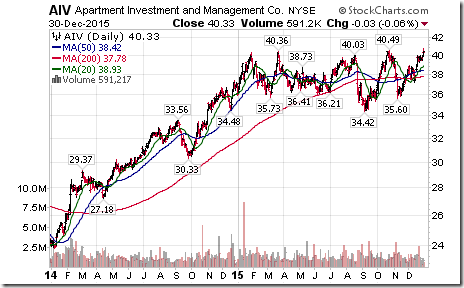
Technical action by S&P 500 stocks to 10:30 AM: Quietly bullish. Breakouts: $AIV, $NVDA. No breakdowns.
Editor’s Note: After 10:30 AM EST, no stocks broke resistance and MLM broke support.
Trader’s Corner
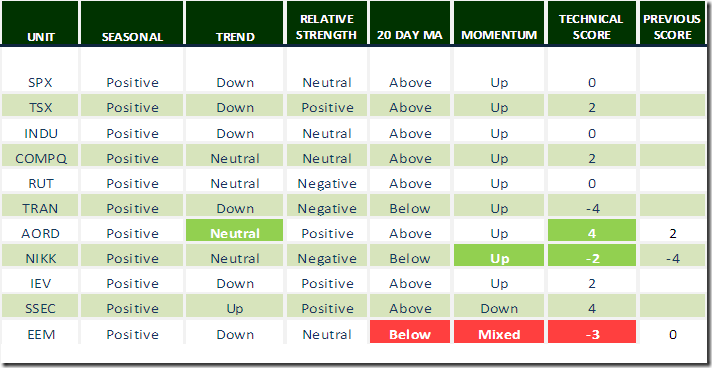
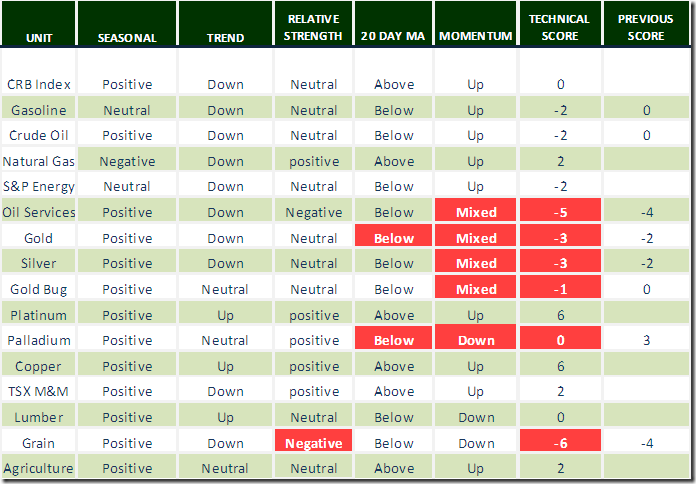
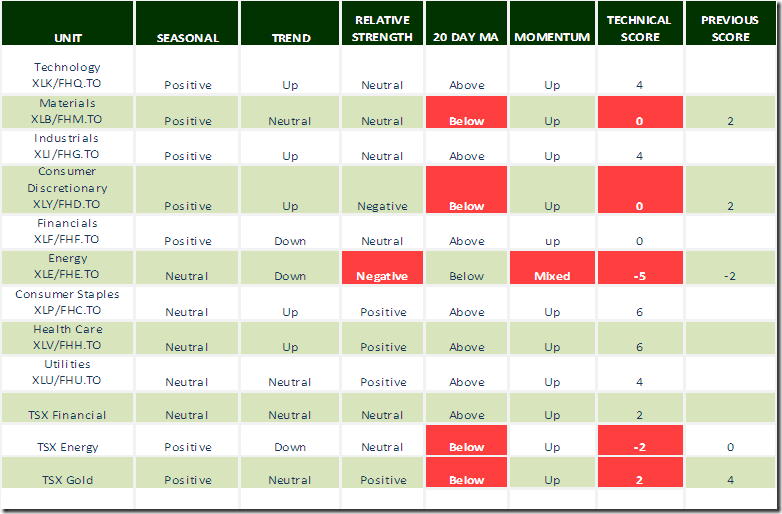
Editor’s Note: Technical scores generally declined when units moved below their 20 day moving average.
Daily Seasonal/Technical Equity Trends for December 30th 2015
Green: Increase from previous day
Red: Decrease from previous day
Daily Seasonal/Technical Commodities Trends for December 30th 2015
Green: Increase from previous day
Red: Decrease from previous day
Daily Seasonal/Technical Sector Trends for December 30th 2015
Green: Increase from previous day
Red: Decrease from previous day
Charting North American Equity Markets into 2016
The Bottom Line: Prospects for the TSX Composite particularly during the first three months of 2016 are above average. Following is a compilation of charts that explain why.
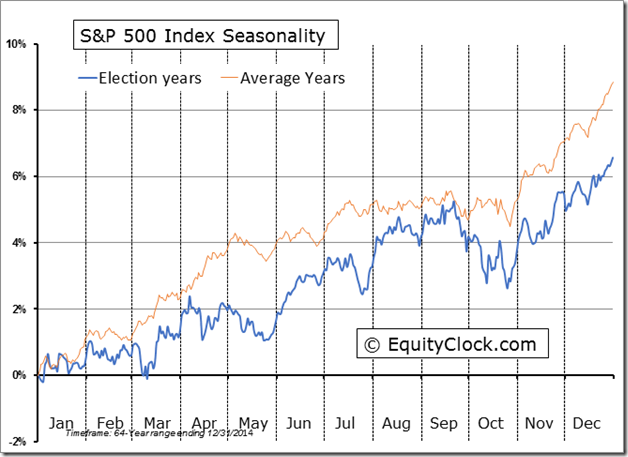
U.S. market performance during a Presidential Election Year is slightly different than other years. Note the relative outperformance from the end of May to the middle of September and the relative underperformance from the middle of September until the end of October
What Happens When Fed Fund Rate Is Increased For First Time
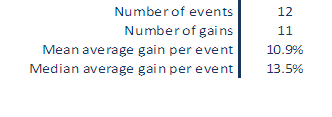
Gains recorded since 1955 by S&P 500 in the three months after the first increase
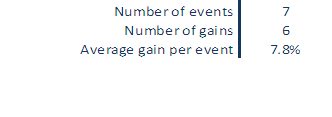
Gains since 1980 recorded by TSX Composite during three months after the increase
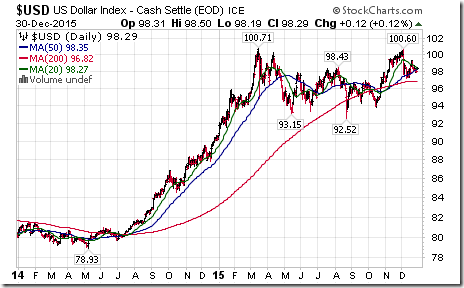
U.S. Dollar Index is following its usual pattern by moving higher prior to the first increase in the Fed Fund rate and by moving flat/lower during the next few months
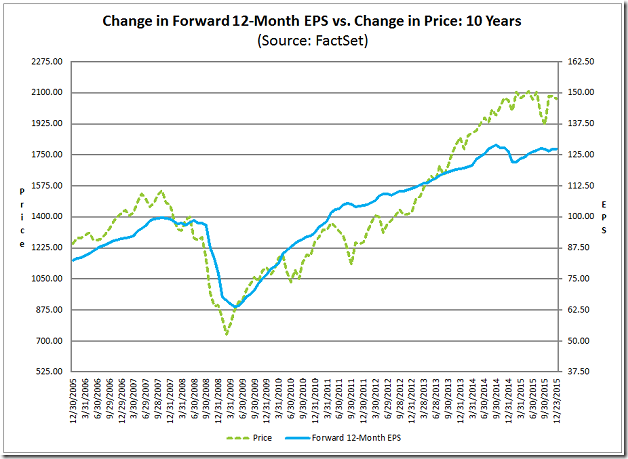
Earnings by S&P 500 companies have stalled (Chart courtesy of FactSet) mainly due to strength in U.S. Dollar Index. Beyond Q4 2015, earnings resume an uptrend. Consensus gain in 2016 is 7.5% over 2015 starting with first gain in the first quarter. Look for lousy fourth quarter results (Current consensus for S&P 500 companies is -4.9% on a year-over-year basis). However, lousy fourth quarter results also will include positive first quarter guidance. Strength in the U.S. Dollar Index no longer will be a drag.
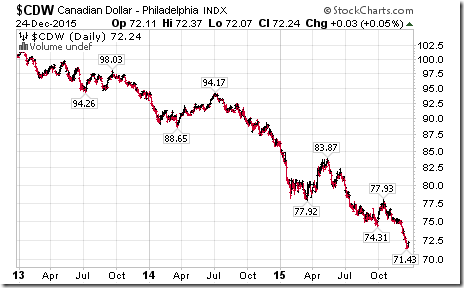
A flat to lower U.S. Dollar Index finally will lead to stability in the Canadian Dollar
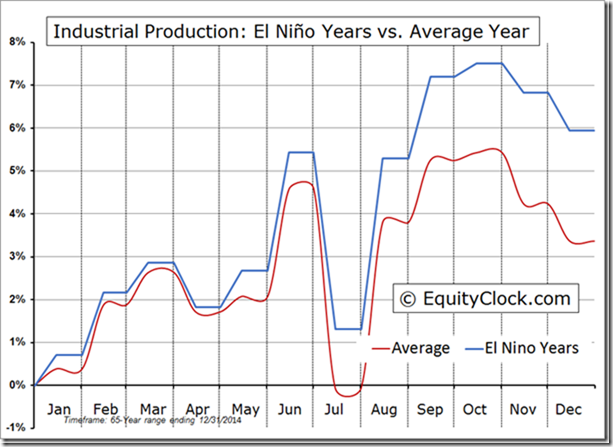
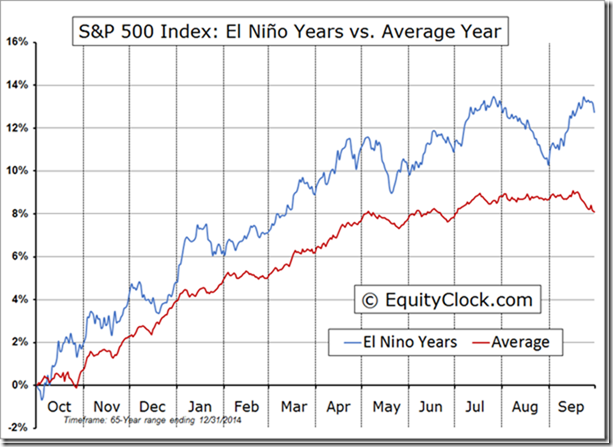
Weather conditions have an impact on equity markets. El Nino years helps U.S. industrial production during winter, which in turn, boosts performance of the S&P 500.
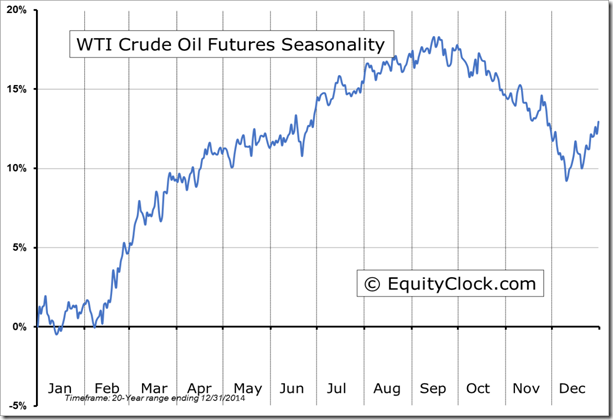
Seasonal influences on Crude Oil bottom in December and move higher into spring.
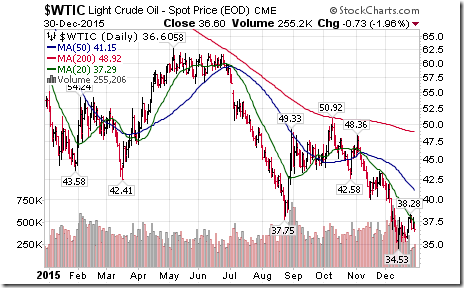
Crude oil prices bottomed on schedule this December
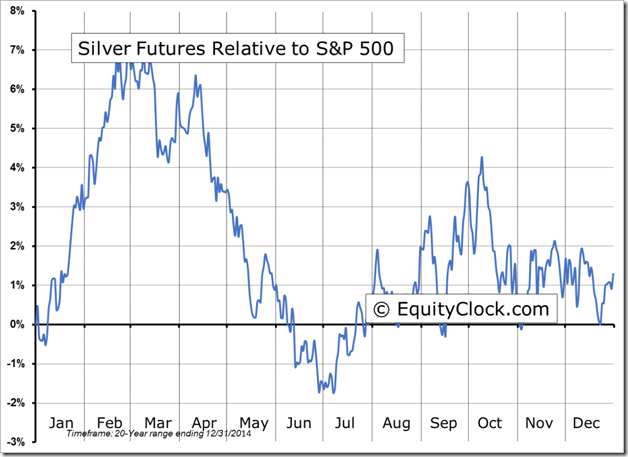
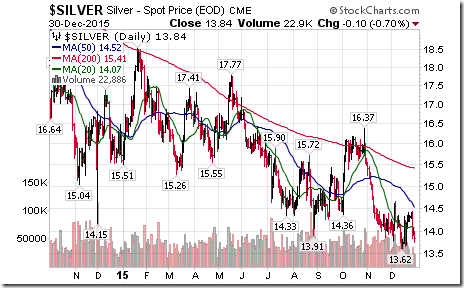
Seasonal influences for Silver turn positive relative to the S&P 500 in mid-December for an upside move until at least the end of February.
Silver prices bottomed on schedule this December
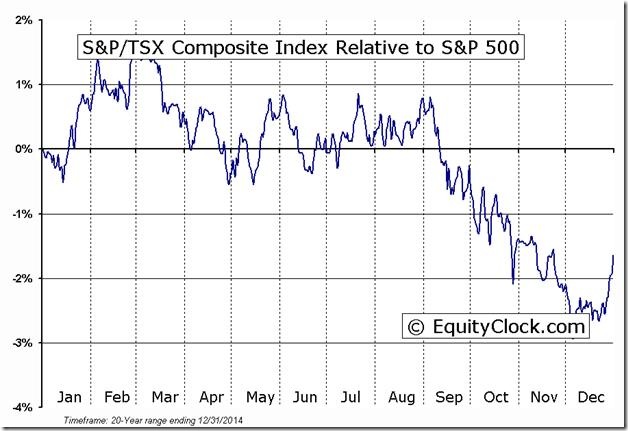
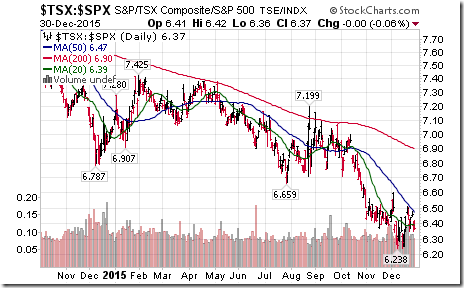
TSX Composite Index has a history of outperforming the S&P 500 Index from mid-December until the end of February.
The TSX Composite Index started to outperform the S&P 500 Index on schedule in mid-December. Improving commodity prices (copper, platinum, silver, gold, crude oil, natural gas) will help in the first quarter
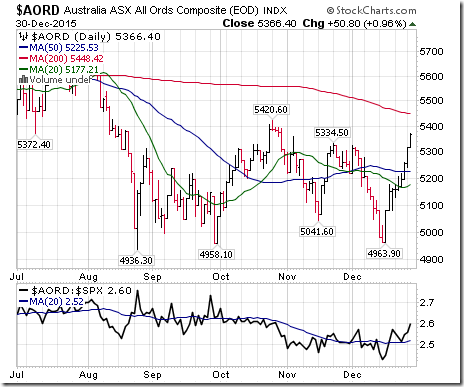
Interesting Chart
The Australia All Ordinaries Composite Index is moving higher thanks mainly a recovery in commodity prices.
Special Free Services available through www.equityclock.com
Equityclock.com is offering free access to a data base showing seasonal studies on individual stocks and sectors. The data base holds seasonality studies on over 1000 big and moderate cap securities and indices. To login, simply go to http://www.equityclock.com/charts/ Following is an example:
Disclaimer: Seasonality and technical ratings offered in this report by www.timingthemarket.ca and www.equityclock.com are for information only. They should not be considered as advice to purchase or to sell mentioned securities. Data offered in this report is believed to be accurate, but is not guaranteed
Copyright © DV Tech Talk, Timingthemarket.ca


