U.S. Stocks Back in the Lead for Last Week's Trading
by James Picerno, The Capital Spectator
US equities regained their bullish footing in the abbreviated trading week through Dec. 24, taking the lead among the major asset classes, based on a set of proxy ETFs. The Vanguard Total Stock Market ETF (VTI) posted a strong 2.8% total return for the four days through Christmas eve. In close pursuit: stocks in foreign developed-market nations via the Vanguard FTSE Developed Markets ETF (VEA).
Although most of the major asset classes gained ground last week, a few corners of the bond market edged lower. Last week’s biggest loser: foreign government inflation indexed bonds, which ticked down 0.2%, based on SPDR DB International Gov’t Inflation-Protected Bond ETF (WIP).
Meanwhile, emerging-market stocks celebrated a minor milestone after last week’s trading action: two consecutive weekly advances for Vanguard FTSE Emerging Markets ETF (VWO). That hasn’t happened since mid-October. The latest upside bias offers support for analysts who say that this slice of global equities is starting to look attractive. Breakingviews.com last week, for instance, reported that Ben Inker (co-head of asset allocation at Boston-based GMO) sees expected returns for emerging market stocks overall at close to 5% for the next 7 years. By contrast, GMO’s projection is slightly negative for US equities over the same span. (For perspective, see The Capital Spectator’s recent risk premia estimates here.) Keep in mind, however, that VWO has yet to shake off the deeply negative price momentum that’s prevailed in recent history, based on a set of moving averages. As such, it’s still premature for declaring that the all-clear signal applies here.

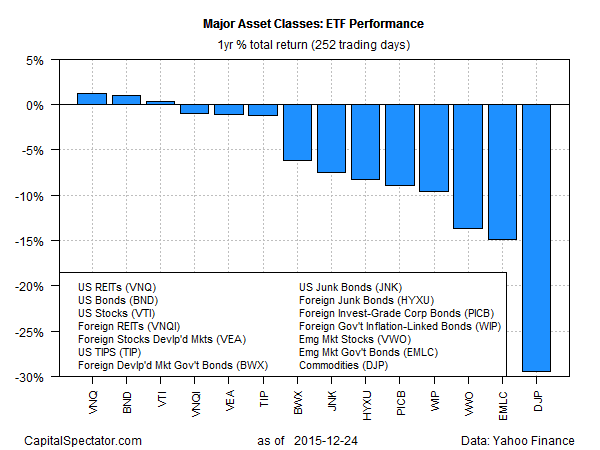
Speaking of dark trends, there’s plenty of that in the trailing one-year category for the major asset classes. A handful of markets are sitting on slight gains for the trailing 12 months through Dec. 24—led by the 1.1% total return for Vanguard REIT ETF (VNQ). Otherwise, losses prevail for 11 of the 14 proxy ETFS over the past year. The red-ink leader (still) for the 252 trading days through Dec. 24: broadly defined commodities, which are down nearly 30%.
Copyright The Capital Spectator