
Money Continues Flowing Out of Oil
For this week’s edition of the Equity Leaders Weekly, we are going to re-examine the energy markets and the price of crude oil given the developments of the most recent OPEC decision and subsequent trading action of the energy related commodity stocks of late.
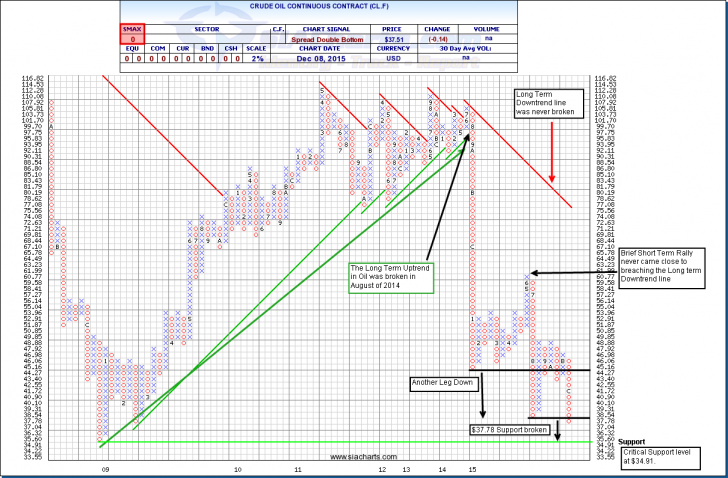
Crude Oil Continuous Contract (CL.F)
The price of oil has fallen quite drastically in the past week as OPEC has decided against a cut in crude production in order to maintain market share. Latest numbers show actual production was higher than the OPEC target of 30 million barrels per day production level. This coupled with non-OPEC nations such as Russia continuing to pump out record supply of crude oil continues to contribute to the worldwide supply glut of oil.
In examining the chart of Oil (CL.F), we see Oil broke its longer term uptrend line at $95.83 back in Aug of 2014 and continued on its precipitous decline until February of 2015 (recall our Sept. 11 2014 edition of the Equity Leaders Weekly, we had noticed weakness begin to occur in the price of oil). After a brief rally heading into the early summer months, we can also see the longer term downtrend line was never broken. We have continued on to lower lows in August at the $37.78 level. With the most recent weakness in the price of oil, we have now broken the August support level of $37.78; the next level of support is at the critical $34.91 level not seen since the stock market meltdown in 2008-2009. Upside resistance is now found at the $45 level.
In hindsight to all this, what we must all consider is the longer term supply/demand relationship as dictated by our relative strength analysis. Crude Oil is still down more than 60% over the past year. The long term downtrend line was never broken during the brief rally that occurred earlier this summer. It is always important to remember there will always be the possibility of short term trading rallies in any asset class or stock such as the case with the past recent trading action of oil. Also keep in mind throughout this whole time period the commodity asset class had remained at the bottom of SIA’s asset class ranking list. This is a primary indicator of relative strength on an asset class level and indicates to you that money is flowing out of that asset class. It is critical to align yourselves with these changing money flows. Paying attention to the longer term trend lines and our “macro” indicator, the asset class ranking list, will help you avoid getting caught in short term trading rallies.
Click on Image to Enlarge
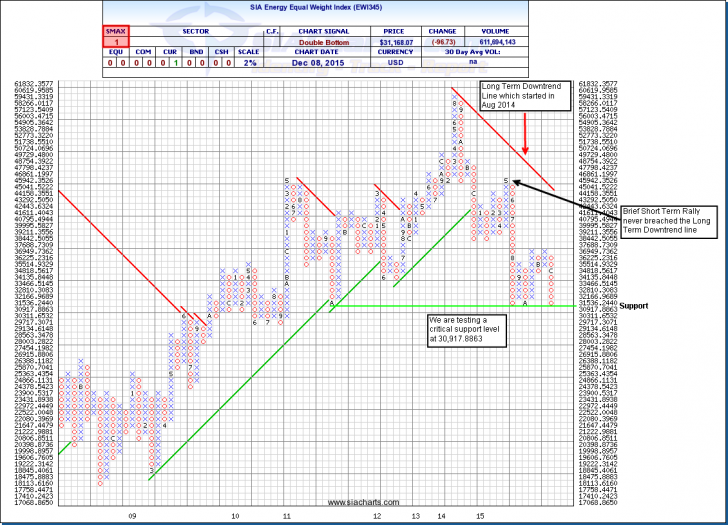
SIA Energy Equal Weight Index (EWI345)
Let’s now examine the SIA Energy Equal Weight Index (EWI345) during this same time frame. The SIA Energy Equal Weight Index is comprised of the 50 most liquid energy names in Canada and the US. As you can see, the longer term down trend line was never broken during this brief short term rally we had seen in oil related stocks. In fact, the EWI345 has almost mimicked the trading action of the price of oil. We now see the SIA Energy Equal Weight Index testing the support level of 30,917.8663 that was reached in August. For example, Chesapeake Energy Corp (one of the components within the SIA Energy Equal Weight Index) has lost more than 77% year to date. EnCana, also another component of the SIA Energy Equal Weight Index, is down more than 50% year to date. These are 2 excellent examples of why paying attention to our long term relative strength analysis can help you protect against any downside risk. In conclusion, it is important to always position yourselves to the longer term risk/reward ratios of being in the right asset classes at the right time. The key to SIA’s philosophy of risk management is to always align yourselves to the longer term trends of the market. Avoiding the “fat part” of the longer term downtrends of the market is just as important as capturing the “fat part” of the longer term uptrends of the market. By positioning yourself to this strategy will help you in avoiding getting caught in any short term rally.
Click on Image to Enlarge
SIACharts.com specifically represents that it does not give investment advice or advocate the purchase or sale of any security or investment. None of the information contained in this website or document constitutes an offer to sell or the solicitation of an offer to buy any security or other investment or an offer to provide investment services of any kind. Neither SIACharts.com (FundCharts Inc.) nor its third party content providers shall be liable for any errors, inaccuracies or delays in content, or for any actions taken in reliance thereon.
For a more in-depth analysis on the relative strength of the equity markets, bonds, commodities, currencies, etc. or for more information on SIACharts.com, you can contact our customer support at 1-877-668-1332 or siateam@siacharts.com.
Copyright © SIACharts.com