No Pain, No Gain: 2016 may require tolerance for volatility
by Burt White, Chief Investment Officer, LPL Financial
KEY TAKEAWAYS
• Although we expect average returns for stocks in 2016, the path to reach them will be anything but routine.
• We expect stocks to produce mid-single-digit returns for the S&P 500, consistent with historical mid-to-late economic cycle performance, driven by mid- to high-single-digit earnings and a largely stable PE.
• This return to a more normal market may mean more volatility, challenging investors’ ability to stay focused on their goals.
This week’s commentary features content from LPL Research’s Outlook 2016: Embrace the Routine.
Gains in 2016 may require tolerance for volatility. Stocks historically have offered a tradeoff of higher return for higher risk, the gain of more upside than high-quality bonds versus the pain of market volatility and losses. For the last few years, U.S. stock markets provided below-average pain, while still providing strong returns. Between October 2011 and July 2015, the S&P 500 Index went nearly four years without a “correction” of more than 10%, while climbing an average of 20% a year.
Although we expect average returns for stocks in 2016, the path to reach them will be anything but routine. LPL Research expects stocks to produce mid-single-digit returns for the S&P 500, consistent with historical mid-to-late economic cycle performance, driven by mid- to high-single-digit earnings and a largely stable price-to-earnings ratio (PE). This return to a more normal market may mean more volatility, challenging investors’ ability to stay focused on their goals.
HOW IS 2016 SHAPING UP?
In 2016, we expect the macroeconomic environment to be molded by a mid-to-late cycle U.S. economy, modest inflation, and the start of a Federal Reserve (Fed) rate hike campaign. If the U.S. does not enter recession in a given year, the probability of an S&P 500 gain is 82%, based on historical data from 1950 to present. Heading into 2016, there have been scant signs of excesses in the U.S. economy that may signal vulnerability to recession. We are always on watch for economic deterioration, but would be surprised if the U.S. economy begins to contract in 2016. In short, this low recession risk points to a potentially positive year for stock markets.
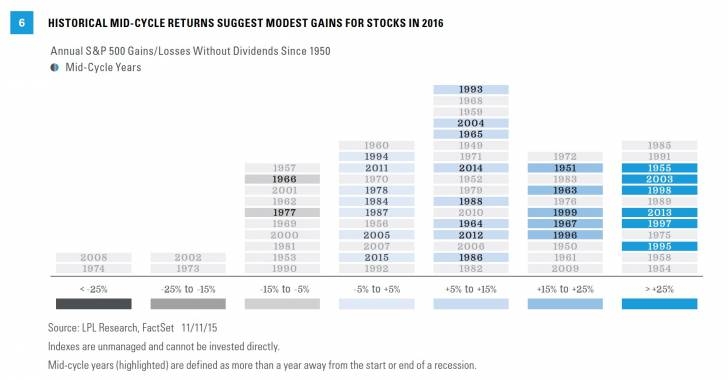
Given our view on the economy, we have high confidence that the range of likely potential market outcomes in 2016 will fall into those highlighted in Figure 1, characterized as mid-cycle years. We believe the worst returns during these years are unlikely. These years included shocks such as severe Fed rate hikes (1994), an inflationary oil shock (1977), and a European debt crisis (2011). We believe the high end is also unlikely, since it also includes several years with unusual circumstances such as a bounce back from an accounting scandal (2003), several years inflated by a stock bubble (1995, 1996, 1998), or recovery from the fiscal cliff crisis (2013).
That leaves -5% to +25% as a reasonable range of outcomes, with +5% to +15% the most likely based on these observations alone. The historical likelihood of a positive year coupled with our low-return expectations for the bond market support our positive stock market view for 2016.
EARNINGS RAMP UP
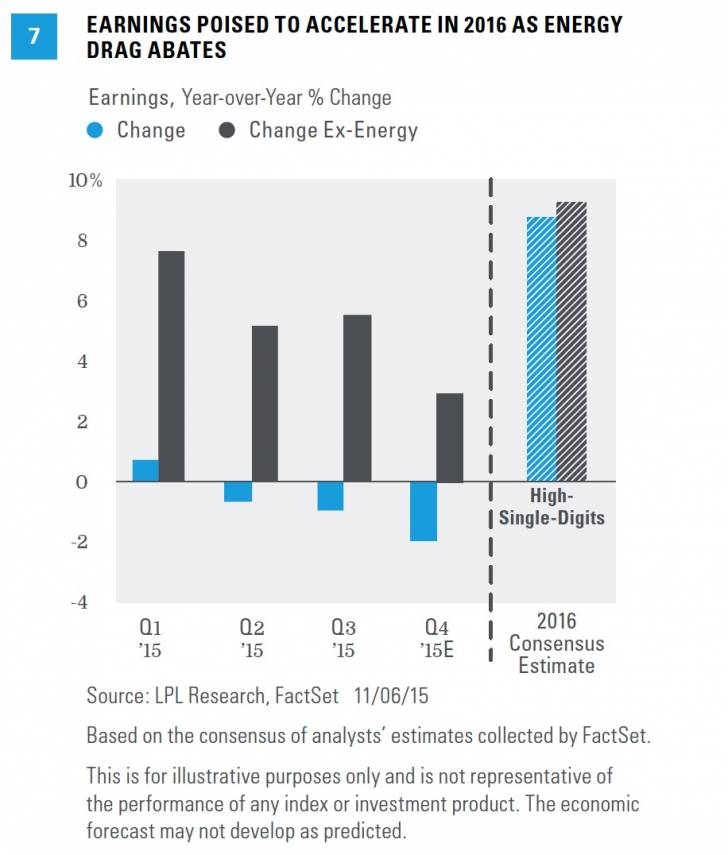
Getting the most out of a routine usually requires a little variety. Corporate profits felt stagnant in 2015, largely due to the drag from a strengthening U.S. dollar and the impact of the drop in oil prices on energy sector profits. Because we expect 2016 U.S. GDP growth near its long-term trend, corporate America should get back to delivering solid profits with mid- to high-single-digit earnings growth (in-line with Thomson Reuters consensus estimates), helping to push the stock market higher. Earnings growth in 2016 is expected to be similar with and without energy included, as shown in Figure 2.
Steady GDP growth in 2016 would set the tone for corporate revenue growth, which historically has correlated well with the growth of the overall economy. Adding in improving growth overseas and a more stable dollar should provide a solid macroeconomic backdrop for revenue, which, through operating leverage, may help support profit margins. Profit margins remain near multi-decade highs and we expect corporate America to maintain strong margins through a combination of: 1) limited wage pressure, 2) cost efficiency, 3) widespread use of automation/technology, 4) low input cost inflation, 5) low borrowing costs due to low interest rates, and 6) falling tax rates as more profits are earned overseas in lower tax countries.
STRETCHING OUT THE BULL MARKET
We expect the generally favorable macroeconomic backdrop to lead to potential stock gains in 2016 and possibly bring the current bull market, one of the most powerful in the S&P 500’s history, to its seventh birthday. The age of the bull market and above-average valuations have led some to question whether stocks may be too expensive to continue to rise. Valuations have not historically been good predictors of stock market performance over the coming 12 months; but, like a regular warm-up, monitoring valuations can help investors’ long-term health.
At 17.6 as of November 23, 2015, stocks are above their long-term average trailing PE of 15.3 (based on S&P 500 data back to 1950), though they are only slightly above the average since 1980 of 16.4.
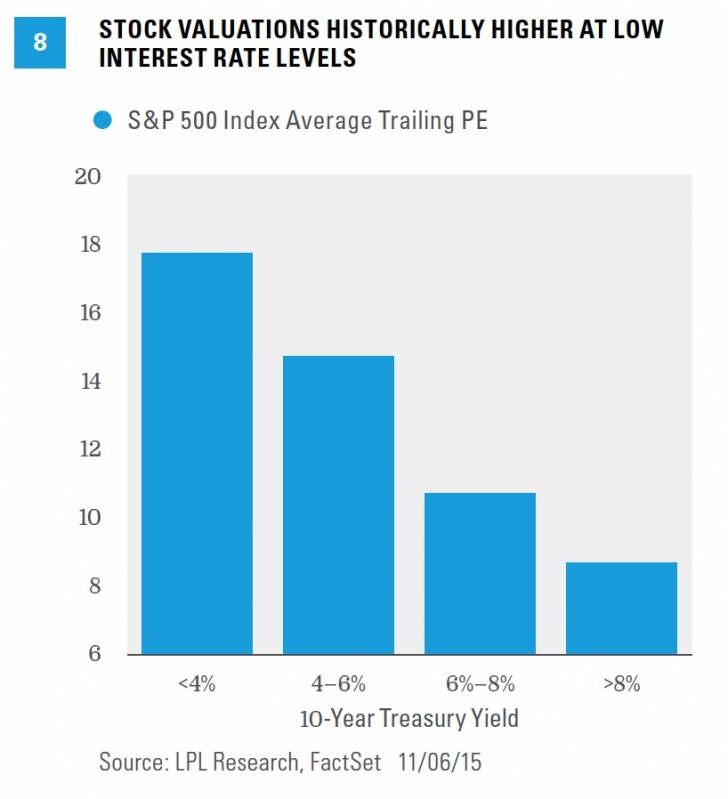
However, these valuations look more reasonable when put in context of low interest rates [Figure 3]. Since 1962, the average trailing PE ratio when interest rates are low (below 4% on the 10-year Treasury) is 17.7 versus 8.6 when they are high (above 8%), suggesting stocks are fairly valued. The relationship is similar when inflation is low.
STICK WITH YOUR HABITS EVEN THROUGH VOLATILITY
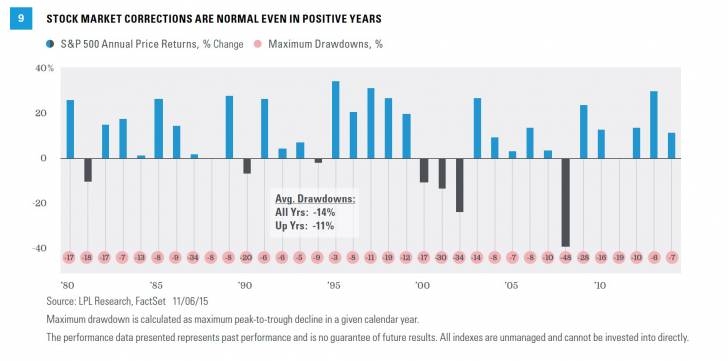
One characteristic of the stock market that is customary, but certainly does not feel that way, is volatility. The S&P 500’s peak-to-trough decline of 12% (May 21 to August 25, 2015) did not feel typical. But this type of pullback is actually quite normal, even in positive returning years. In fact, since 1950, the average peak-to-trough decline for the S&P 500 is 14%; even in positive returning years, the average is 11%, and the index suffered at least a 10% correction in 41% of those positive years [Figure 4]. Another way to show that the volatility experienced in 2015 is closer to the norm is by looking at the VIX, a measure of implied stock market volatility. The year-to-date average for the VIX in 2015 is 16.6, above the average of the prior two years between 14 and 15, but below the 20-year average (20.9) and the average during the current bull market (19.6).
We expect volatility to be with us again in 2016 as the business cycle ages, making sticking to your long-term investment habits even more important to avoid locking in losses and missing out on opportunities. A number of factors beyond the aging business cycle could lead to increased market volatility in 2016. The Fed is about to embark on its first rate hike campaign since 2004–06. A further pronounced drop in oil prices — though not our expectation — could negatively impact the global economy and markets. And recent terrorist attacks in Paris and the associated military response highlight the heightened geopolitical risk in the Middle East and throughout the world.
CONCLUSION
Stocks, we believe, will not collapse, as many think, or soar, as many hope, but may offer near historical routine returns as earnings start to normalize and oil markets find their equilibrium. But we are still in the second half of the economic cycle, and investors need to be vigilant about monitoring pockets of volatility and potential signs of an economic downturn.


