Continued Dollar Strength and Commodity Prices
It has only been about 2 months since we last looked at the USDCAD and Crude Oil charts, but in that time there have been some notable movements. So for this week's SIA Equity Leaders Weekly we are going to look back on both of these to see what's been happening recently.
United States Dollar/Canadian Dollar (USDCAD)
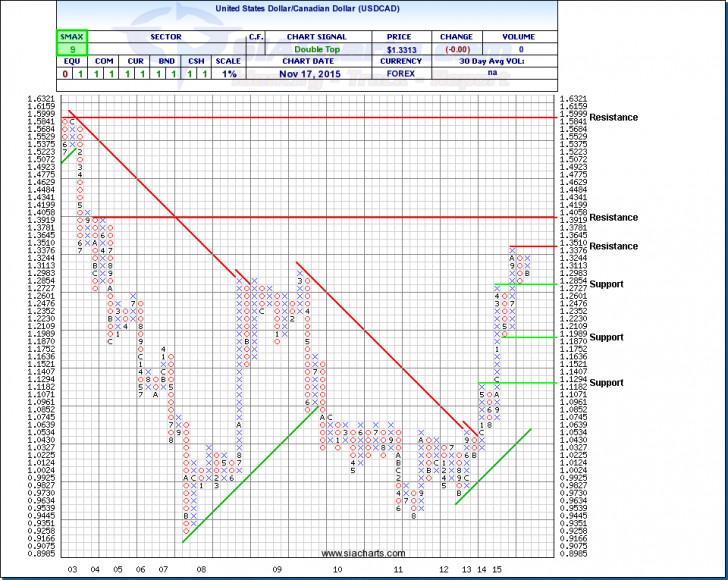
Back on July 15th, 2015 we reported that the currency pair just broke through resistance at the $1.2854 level. It then continued to run and top-out at $1.3510 in early October before developing the recent pullback. Looking at the 1% scale chart, you can see the pullback is represented with the most recent 4-box column of O's which took place in October. Jump ahead a month and we are now witnessing on the chart a 3-box reversal to the upside with the newly plotted column of X's. The interesting thing to keep an eye on is whether the currency pair is able to breakthrough $1.35 and test the $1.40 waters. With so many political and economic events influencing the direction of the currency, as well as the increased volatility, failure to continue through current resistance levels could result testing support levels at the $1.2727 and potentially lower at $1.1870 levels. Going forward into the end of the year and onto 2016, the central banks on either side of the border may dictate or have the most influence on direction based on respective interest rate policy.
Not to sound like a broken record player but with the continued strength in the US dollar, we have seen the continued weakness in most commodity influenced economies. Therefore continued weakness with investments exposed to both the Energy and Materials sectors.
Crude Oil Continuous Contract (CL.F)
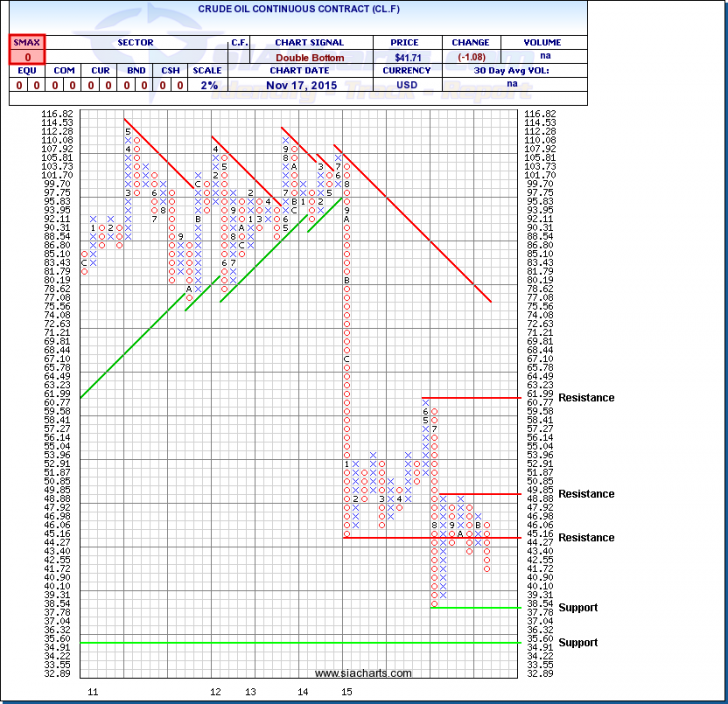
Since last looking at the Crude Oil chart, the upward run in early October failed to break above that $50 level, then changed directions, and now looks to have its sights set on testing $40. Since the $49.85 resistance level has held up twice now, that level might be a difficult one to break. To the downside, the chart is fairly open with major support not seen until $37.78 and then $34.91. With an SMAX score of 0 out of 10, Crude is continuing to show near-term weakness against all asset classes.
Looking at the two charts together there is a strong negative correlation between the two; their long-term movements continue to mirror each other in the reverse. Many see the global oversupply of oil continuing to worsen, causing falling prices, which helps pull down the loonie; hence the negative correlation. But there is also many moving parts at play that need to be carefully monitored. Pay close attention to ongoing US interest rate policy, the effects on the USDCAD relationship, turmoil in Europe and the Middle East, and as well as the economic uncertainty in China and neighboring countries.
Click on Image to Enlarge
SIACharts.com specifically represents that it does not give investment advice or advocate the purchase or sale of any security or investment. None of the information contained in this website or document constitutes an offer to sell or the solicitation of an offer to buy any security or other investment or an offer to provide investment services of any kind. Neither SIACharts.com (FundCharts Inc.) nor its third party content providers shall be liable for any errors, inaccuracies or delays in content, or for any actions taken in reliance thereon.
For a more in-depth analysis on the relative strength of the equity markets, bonds, commodities, currencies, etc. or for more information on SIACharts.com, you can contact our customer support at 1-877-668-1332 or siateam@siacharts.com.
Copyright © SIACharts.com


