Trend-Following is Dead
by Michael Harris, Price Action Lab
Arguments in support of trend-following usually rest on performance achieved by the CTA group in the 1990s. Recent performance of this group has deteriorated due to changes in market dynamics. Trend-following of equity indexes has performed better recently due to special macroeconomic conditions.
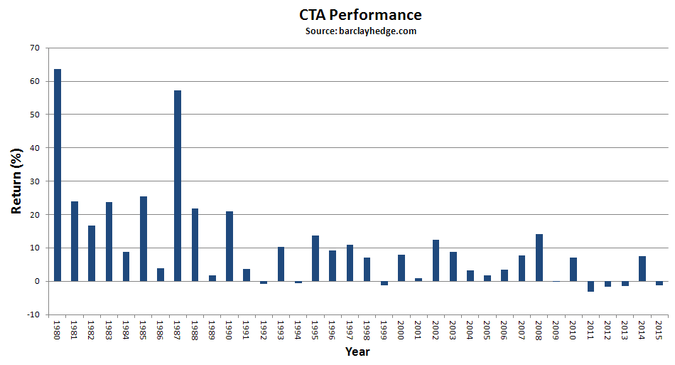
There is this argument that trend-following works and the proof is the existence of a multi-billion CTA industry that has produced high absolute returns. However, CTAs generated high absolute returns in the 1980s and 1990s. After 1991 returns are below 14% on the average. With the exception of 2008, after 2003 returns are mediocre and include a three-year losing streak from 2011 to 2013, as shown on the chart below:
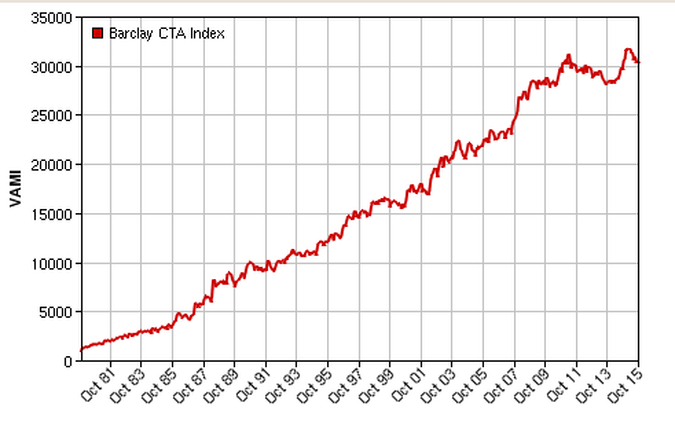
The positive performance in 2014 is due to the fact that many trend-followers traded more heavily stock index futures and related ETF products after having realized losses in bonds and commodities. Realized returns in the last 24 years by the CTA group do not justify the high risks of trend-following. However, when the above returns are compounded, then one obtains an equity curve with positive slope. This type of curve is usually presented as evidence of the efficacy of trend-following:
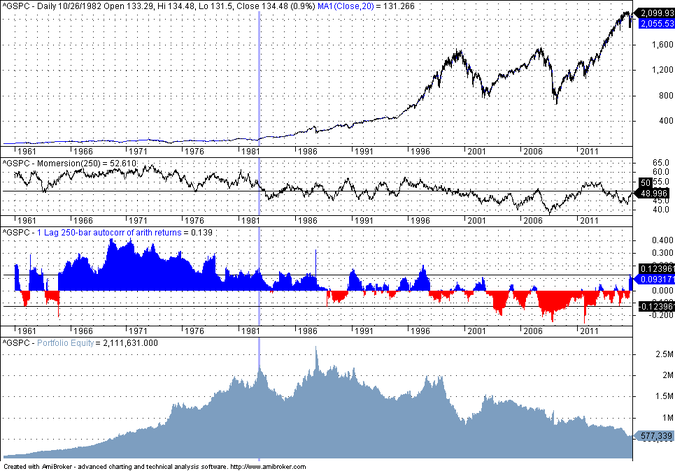
It is evident even from the above VAMI (Value Added Monthly Index) chart that there are problems with CTA results in recent years. The deterioration in performance agrees with the fact that serial correlation of daily returns was arbitraged out in the 1990s. For example, in the equity markets, any significant serial correlation vanished in the mid 1990s, as shown on the S&P 500 chart below:
The 1-lag, 250-day serial correlation is shown on the second indicator pane of the above chart along with the bands for the 95% confidence interval. There is a shift from significant positive to significant negative serial correlation. This also agrees with the results of my Monersion indicator and recent claims by Jim Simons.
The bottom pane of the chart above shows the equity curve of a long/short 1-20 moving average crossover system. The performance of this system started to deteriorate in the 1980s and then turned negative in the 1990s. This is in agreement with the first chart of CTA yearly performance. The CTA group struggle to maintain positive returns began in mid 1990s and results are getting worse since.
Analysts with a backtesting program – and there are many such programs available even for free nowadays – will declare high absolute returns of trend-following systems in out-of-sample tests after repeatedly changing parameters and possibly reshuffling the traded universe. However, the results are not statistically significant if they are not compensated for data snooping and selection bias.
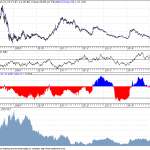
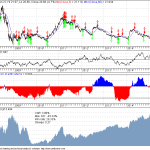
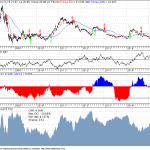
Below, I include backtest results of three basic trend-following systems in DBA and DBC, two commodity ETFs. DBA tracks the performance of agricultural futures and DBC tracks a larger basket of futures contracts that is more heavily weighted towards energy and precious metals. I test the 50-200 moving average cross and the faster 5-30 and 1-20 crossovers.
All backtests in this article are for long/short positions with fully invested initial capital of $100K and $0.01 per share commission.
DBA (Click on charts to enlarge)
 |
 |
 |
Performance parameter table:
| Parameter | 1-20 | 5-30 | 50-200 |
| CAR | -9.93% | 3.98% | 4.28% |
| Max. DD | -62% | -45.34% | -41.67% |
| Sharpe | – | 0.27 | 0.42 |
It may be seen from the above table that the 1-20 cross fails as expected due to the negative serial correlation. The faster 5-30 cross produces random results and a small Sharpe and the slow 50-200 has large drawdown in addition to a volatile equity curve. In short, basic trend-following has not worked at all in DBA since its inception in January of 2007.
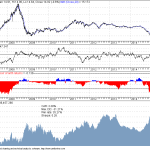
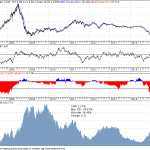
DBC (Click on charts to enlarge)
 |
 |
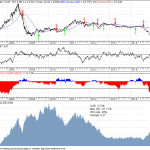 |
Performance parameter table:
| Parameter | 1-20 | 5-30 | 50-200 |
| CAR | 3.39% | 2.41% | 3.73% |
| Max. DD | -31.21% | -34.48% | -51.71% |
| Sharpe | 0.26 | 0.21 | 0.27 |
It may be seen that in all cases Sharpe is very low, indicating that the results are not significant. Also, it is interesting that the 1-20 cross, i.e., price crossing above or below the 20-day moving average, produced the lowest drawdown. This is probably a random outcome that is related to the distribution of serial correlation in DBC.
ETF Portfolio results
Next, a portfolio of ETFs is backtested with the following parameters:
Period: 01/2007 – 11/09/2015
Frequency: Daily
System type: 50-200 crossover, long/short
Initial capital: 100K
Commission: $0.01 shares
ETFs: SPY, TLT, DBC, DBA, GLD
Allocation: 20%
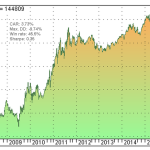
The equity curve and monthly performance are shown below. (Click on charts to enlarge):
 |
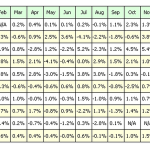 |
The CAR is only 3.73% in the test period as compared to 6.54% for SPY buy and hold. The ETF portfolio has better risk adjusted performance due to diversification with a MAR (CAR/Max. DD) of 0.38 versus 0.12 for SPY buy and hold. Note that SPY had a large drawdown of -55% due to the financial crisis. However, any diversification benefits are not specific to trend-following. The same benefits can be realized by different allocation methods and timing models. In other words, the high risk of trend-following due to low Sharpe ratios and win rates cannot be justified by an appeal to diversification, because the latter can be realized with other models.
Counterarguments and discussion
There are various counterarguments in support of trend-following. Some are based on curve-fitted results, i.e., selecting the best parameters that produce a smooth equity curve on historical data and some are based on the performance of systems that trade a large number of different markets, i.e., on diversification, as discussed above. The latter type of arguments often do not clarify position size methodology and account size required for trading a large number of contracts and, in addition, do not usually account for liquidity constraints, as some of the contract are thinly traded. Such analysis often does not account for the possibility of the correlation between many of these contracts increasing in the future, resulting in even larger drawdown levels. In addition, the amount of overall leverage is hard to estimate. It may be easy to backtest a portfolio of a large number of futures contracts, on a per contract basis, but the required initial capital is often determined in hindsight.
More importantly, since futures trading is a zero-sum game, the success of trend following of large AUM CTA programs using futures or of other funds in general depends on the availability of a large number of speculators that take the opposite side and eventually lose. Analysts with a backtesting program usually ignore these fundamental issues and assume that the market offers unlimited liquidity to their strategies. However, reality is much different: When a strategy is backtested, it is not a market participant. This is possibly one of the most severe limitations of backtesting. Due to this and several other constraints, backtesting can only help analysts to decide which strategies not to use and not which strategies to use. Unfortunately, many analysts do not understand this and fall victims of the dubious process of backtesting. I have talked about these limitations in my 2005 Book Profitability and Systematic Trading, in more detail with examples in my new book, Fooled by Technical Analysis and also in several article, for example here and here.
It is naive to claim that a trend-following strategy is viable because the backtesting results look good. As the actual results of CTA performance show, trend-following is in trouble, if not dead already. I believe that trend-following is dead because, among other things, the market cannot deliver profits to all those trend-followers that try to harvest absolute returns. The market will adjust in the presence of such massive efforts and it has already done that, rendering most of these strategies ineffective. In other words, trend-following is a market inefficiency of the past that is already arbitraged out to a large extent. Note that this does not mean that there will be no trends in the markets. It only means that it will be difficult to make a profit from them. It is a mistake to equate the existence of trends with trend-following success. However, many make this mistake. Furthermore, no one claims that trend-following did not work in the past. It did but slowly its performance deteriorated.
There are possibly trend-following models that still work well due to special conditions in some markets, for example in the equity markets that were boosted by a prolonged stimulus period. But these are aberrations and do not imply that the future will be like the 1980s and the 1990s. Those golden periods for trend-following are behind us and it is highly unlikely that they will repeat in the future.
With trend-following becoming unprofitable, traders must look for new market inefficiencies to profit from. There are a few but they are hard to identify. The times of backtesting trivial models and then making profits are gone because anyone can do that. I will talk about what type of inefficiencies to look for in another article.
You can subscribe here to notifications of new posts by email.
Charting program: Amibroker
Disclaimer
New book release

Publisher: Michael Harris
Date: September 1, 2015
Language: English
270+ pages (6″ x 9″ trim)
74 high quality charts
Available online only
Table of Contents
© 2015 Michael Harris. All Rights Reserved. We grant a revocable permission to create a hyperlink to this blog subject to certain terms and conditions. Any unauthorized copy, reproduction, distribution, publication, display, modification, or transmission of any part of this blog is strictly prohibited without prior written permission.


