Go East, Young Man
by Erik Swarts, Market Anthropology
 Since our last update on the Nikkei a few weeks back (see Here), the index pivoted sharply higher, reaching a fresh retracement high on October 9th - approximately 9 percent above its September 29th low. Notably absent from the sharp rally in the Nikkei was the typical accompanying weakness in the yen, which we have speculated would begin to modulate from the negative correlation extreme that took shape after Abenomics was first floated in November 2012.
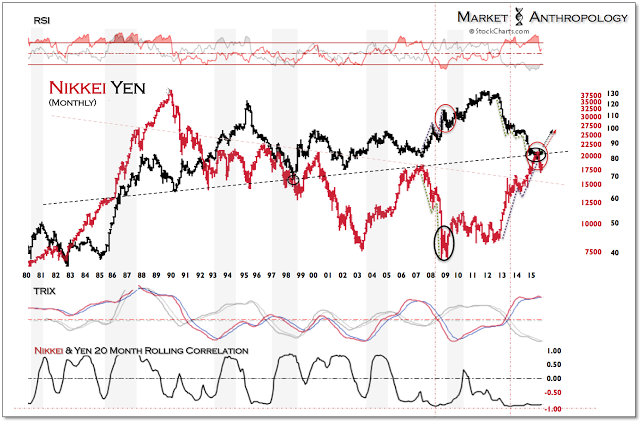
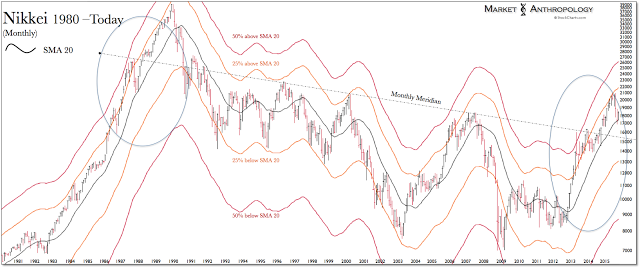
Historically speaking, the consistent negative correlation relationship that has been maintained in the markets since the fall of 2012, has been the longest of such stretches over the past four decades (Figure 1). And while the steady decline in the yen had helped the Nikkei break out from its perennial quarter century decline last year (see Here), many participants and pundits have recently grown increasingly concerned that Japan's bold monetary and fiscal experiment had reached its limit of influence and with little affect towards inflation.
From our perspective, those concerns are exceedingly short-sighted and misplaced (see Here) and ignore the big picture developments in Japan's capital markets that have been leading the way in building out the foundations for the next cycle. Overall, we continue to be long-term bulls on Japan's equity markets and also like the value prospects offered by the yen today, which by the BOJ's own measure is at its weakest levels since the breakdown of the Bretton Woods system over forty years ago.
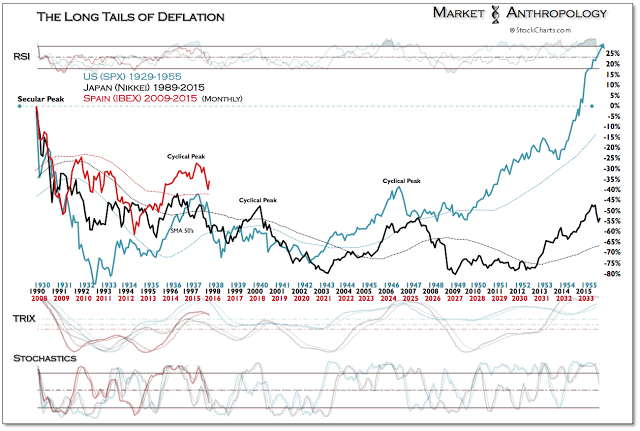
Like many causal debates in the markets we find conditions in Japan pragmatically representative of the age-old rhetorical question, "Did the times make the man or the man make the times?", with the explicit understanding that it's a bit of both, but with the determining factor primarily a result of the times - or length thereof. Japan was the first developed economy to have its massive asset bubble burst in 1990, the first to enter the long-term yield trough, the first to enact ZIRP and QE - and we'd speculate will be the first developed economy to emerge from the previous secular credit cycle's considerable overhangs; conditions they had waded through sheepishly over the past three decades until Shinzo Abe grabbed the opportunity to disrupt market behavior in the fall of 2012. Although the deflationists appear to be anxiously grabbing their popcorn to catch the end game they envisioned over the past 2 decades, we expect their Branch Davidian expectations to largely go unrealized. The l o n g and short of things, Japan's time has come (Figure 10 - see Here).
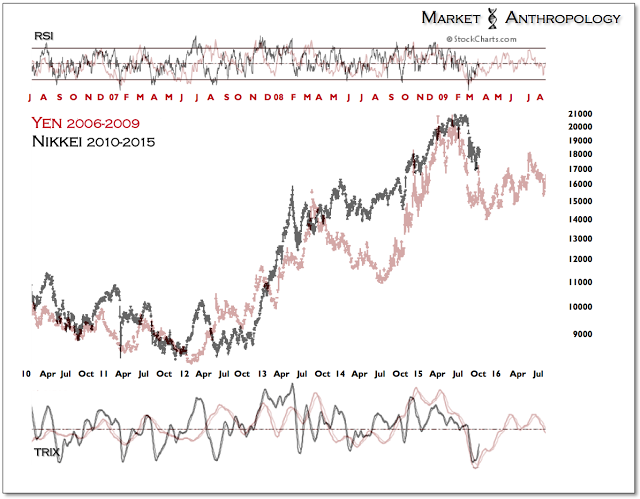
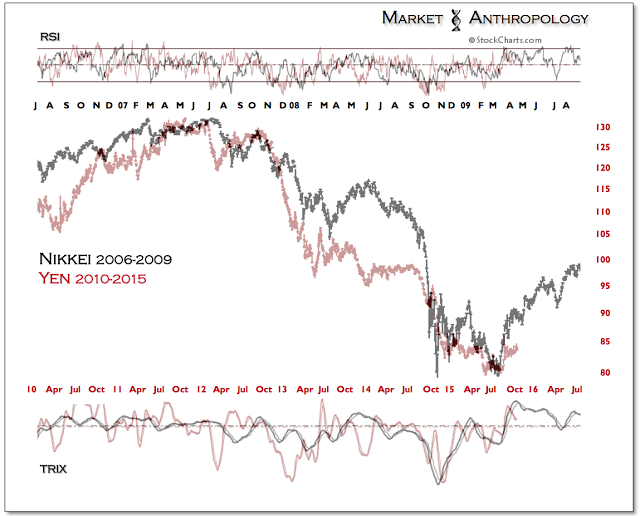
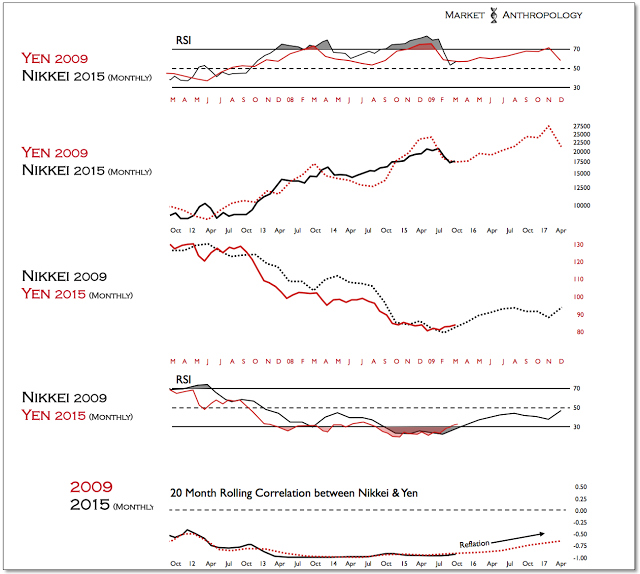
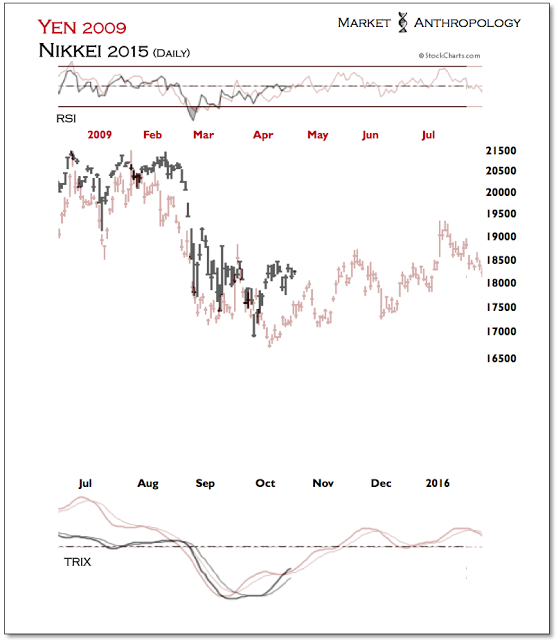
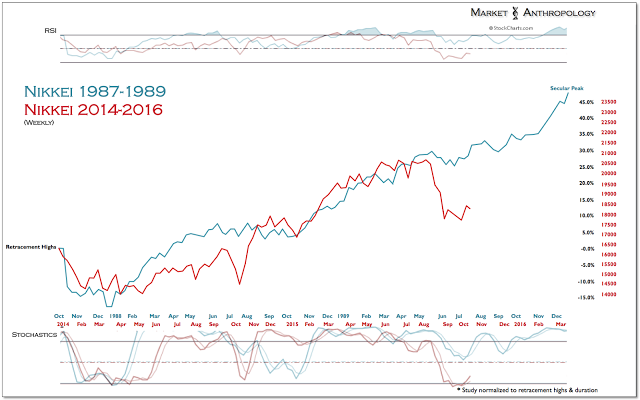
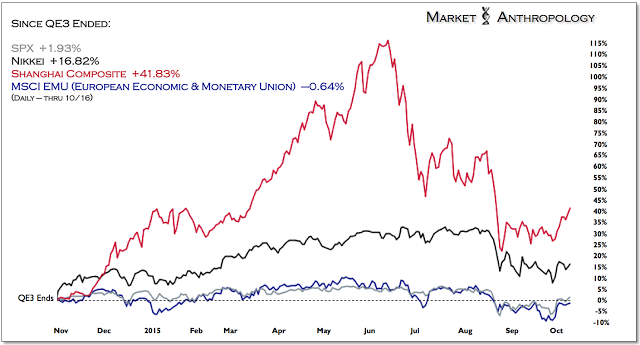
As such, we continue to favor the prospects of the Nikkei relative to the S&P 500, where further policy normalization by the Fed will likely limit future returns in US equities - as we now make our own way across the long-term yield trough. As mentioned in previous notes, we are looking for the correlation extreme between the Nikkei and yen to thaw, in a manner similar to the reversal in Q1 2009. The difference of course being, that the trends today between the Nikkei and yen are inverse to that time (Figures 2-3). That said, we expect a similar outcome from the correlation extreme that also takes a reflationary path for both assets (Figure 4). Although another retracement move lower in the near term (Figure 5) would not surprise us, we expect the Nikkei to continue to step higher and outperform US equities through the end of the year.
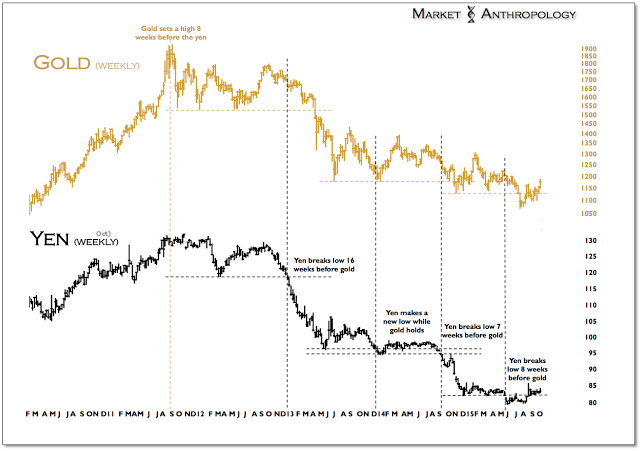
Moreover, both gold and the yen have trended closely together (Figure 9) since the equity markets peaked in October 2007 and the financial crisis unfolded over the next two years. While gold set its closing high eight weeks before the yen in 2011, it has since followed the downside breaks in the yen over the past 4 years with varying lags of several weeks - the most recent breakdown in the yen this May occurring 8 weeks before gold.
Trending higher together since early August through a weaker US dollar, both assets have recaptured previous support and appear poised to take the next step up along a shared reflationary path.
 |
| Figure 1 |
 |
| Figure 2 |
 |
| Figure 3 |
 |
| Figure 4 |
 |
| Figure 5 |
 |
| Figure 6 |
 |
| Figure 7 |
 |
| Figure 8 |
 |
| Figure 9 |
 |
| Figure 10 |


