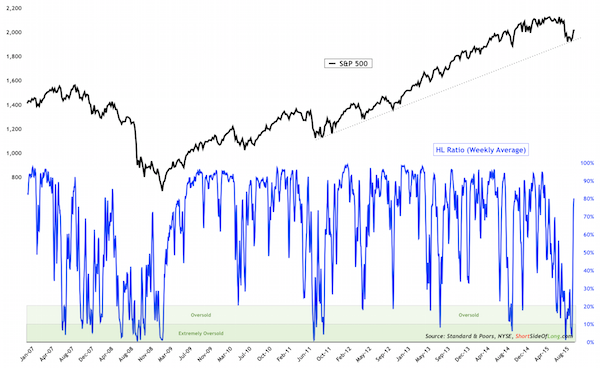
Home on the range for the S&P 500
by Erik Swarts, Market Anthropology
From a long-term perspective, it's been over a generation since the equity markets did not either nominally trend higher or lower with any lasting momentum for more than 2 years. Generally speaking, this has polarized longer-term biases and expectations by visualizing market returns as predominantly a binary outcome from a two way street.
The mid to late 1970's, when the US economy was struggling with inflation and a growing energy crisis at home and abroad, was arguably the last time investors were faced with a perennial range-bound market environment that did not rewarded dogma handsomely for long on either side of the field. Before that, there were two 2-year periods (1959-1961 & 1952-1954) where the equity markets treaded water in a relatively (<20%) narrow range.
That said, the longest sideways churn over the past 70 years was between 1946 and 1950; a period we have continued to focus on for guideposts over the past year (most recently Here), due to the similarities with 1) normalizing policy from extraordinary monetary support 2) the disposition of yields in the long-term cycle trough, and 3) cyclical equity market performance and valuation trends that, in our opinion, are derivative and proportional of the broader long-term yield cycle (Figure 1).
With another Fed meeting guiding policy expectations around the corner next week and the S&P 500 essentially flat and at the mid-point of its range over the past 13 months, we feel participants should be open to the possibility that rangebound conditions in US equities could continue far longer than recent history would suggest, as markets slowly normalize from extraordinary policy support - as they did before between 1946 and 1950.
Not coincidentally, this period in history became the back half of the previous long-term yield trough, as the economy neither fell back on participants worst fears into another chapter of the Great Depression, nor was ready to begin the leading stage of the next major global growth cycle. It wasn't until after 1950 that yields and equities began to break out of their respective multi-year ranges (Figure 5), after markets had digested the aftermath of the previous secular credit cycle and conditions in the economy allowed the Fed greater latitude to enact policy by materially raising and lowering the fed funds rate.
Although this time around large-scale asset purchases by the Fed continued for more than 2 years longer than Fed and Treasury operations during the 1940's, the correlation between equity performance and the build in extraordinary asset purchases extended to the markets is quite similar (Figure 2). Over the past year we have panned the longer-term prospects of US equities as the markets pushed up against another valuation ceiling and continued the atypical process of normalizing policy from QE and ZIRP.
While the markets will invariably make their own distinct path, from our perspective and similar to the momentum signatures of the 1946 trend break (Figures 3 & 4) through that fall - another trip lower to once again test the bottom of the range would appear to be a distinct possibility over the next several weeks.
- Click to enlarge images -
 |
| Figure 1 |
 |
| Figure 2 |
 |
| Figure 3 |
 |
| Figure 4 |
 |
| Figure 5 |
 |
| Figure 6 |


