Could HY distress be a red herring?
by Cam Hui, Humble Student of the Markets
I received a lot of skeptical feedback to my last post, probably because of the provocative title (see A "What's the credit limit on my VISA card" buy signal). The pushback can be categorized two ways. A number of chartists were still bearish. As well, there were worrisome signs from the credit market. I want to address the latter issue, as cross-asset, or inter-market, analysis signals are something that I pay special attention to.
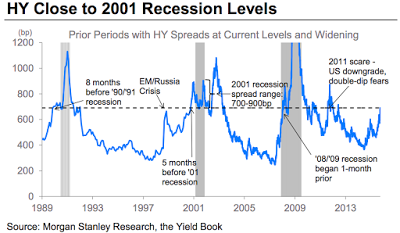
HY spreads are blowing out
A number of readers point to articles like this one from Business Insider, in which UBS and Morgan Stanley highlighted recession risk because of widening credit spreads:
Market-watchers have pointed to the recent spike in high-yield bond spreads and noted that this is the kind of move that happens as an economy goes into recession.
The high-yield bond market is particularly sensitive to economic cycles. Commonly referred to as junk bonds, these debt securities are issued by companies with low credit quality. Because of the higher risks that come with lending to such companies, they have to offer higher yields than those of their investment-grade peers. When spreads increase, it's costing more for these junk corporates to borrow.
"US high yield credit has faced one headwind after the next — from significant distress in Energy, to risks of weakening global growth, to significant uncertainty around Fed rate hikes," Morgan Stanley's Adam Richmond said on Friday. "As a result, HY just posted the weakest four-month stretch (Jun-Sep) since the end of 2008, -7.03% in total return. This selloff has driven very negative sentiment, as nothing brings the bears out of hiding more so than low prices, feeding into panicky price action in markets."
"The simple point — it doesn’t happen often — only shortly before recessions or during major growth scares," Richmond said.
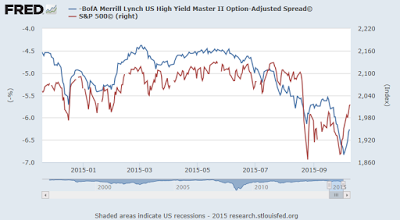
All the talk about recession risk got my attention, as recessions are bull market killers. In addition, widening credit spreads are also bad news for stock market bulls, as they are indicative of falling risk appetite. Here is a FRED chart of HY spreads (blue, inverted scale on left) and the SPX (red, scale on right):
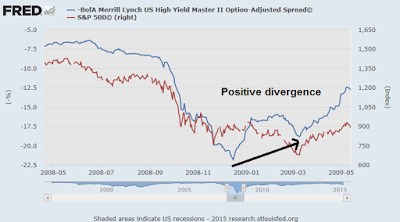
How worried should we be about credit spreads? Here is the same chart at around the time of the Lehman Crisis. We can see a positive divergence at the March 2009 low as HY spreads were tighter than they were at the time of the first spike. But then, that effect was somewhat predictable as the fiscal and monetary authorities were taking steps to ride to the rescue, so you would expect credit spreads to begin to narrow.
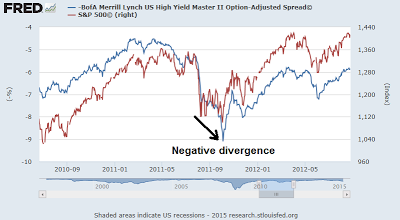
Here is the same chart in 2011, where we saw HY spreads blowing out to new highs (or lows as the chart is inverted) at the final stock market's final low. In other words, HY was showing a negative divergence at the equity market bottom.
Are HY spreads a leading, lagging or coincidental indicator of stock prices? The evidence is inconclusive. It seems that credit move approximately in-line with stock prices. The credit market represents a useful indicator of cross-asset risk appetite and it can warn or confirm bull and bear trends. Both positive and negative divergences need to be confirmed by other indicators. By itself, rising credit spreads is a red herring and tell us nothing about where stock prices are going.
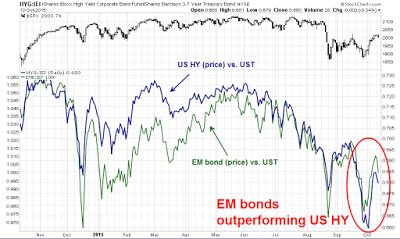
Why is EM outperforming US HY?
Still not convinced? Consider this chart of the relative price performance of US HY vs. their equivalent duration US Treasury proxies and EM bonds vs. their equivalent duration US Treasury proxies . You will recall that much of the angst surrounding the current downdraft stemmed from a slowing Chinese economy and worries about emerging market economies. If that's the case, why are EM bonds outperforming US high yield?
The moral of this story is to beware of uni-variate, or single variable, analysis whose results are not confirmed by other models.

Copyright © Humble Student of the Markets


