The Latest Margin Debt Figures Confirm A Major Bear Market Is Probably Underway
by Jesse Felder, The Felder Report
Back on May 6th, as the stock market was pushing to new highs, I argued here that, “record-high margin debt should make you more cautious,” toward the stock market. At the time, it was popular to dismiss the idea that the level of margin debt, both absolute and relative (to GDP), should mean anything at all. Since then, stocks have fallen hard, along with margin debt levels, and the message it sends is even more meaningful today.
The simple reason I believe margin debt is a valuable indicator is that at extremes it is a very good measure of potential supply and demand for stocks. When margin debt is very low it tells us there is a lot of potential demand out there for stocks. Conversely, when it’s very high it signals that there is very little potential demand left and plenty of potential supply. If you believe supply and demand are the key to prices then this measure is something you should watch very closely then.
Recently, we hit record-high levels of margin debt, on both an absolute level and in relation to overall economic activity. I like to look at margin debt relative to GDP because it is a simple way to measure the popularity of financial speculation relative to overall economic activity. When this measure is very high, it tells me investors are highly interested in speculating in equities.
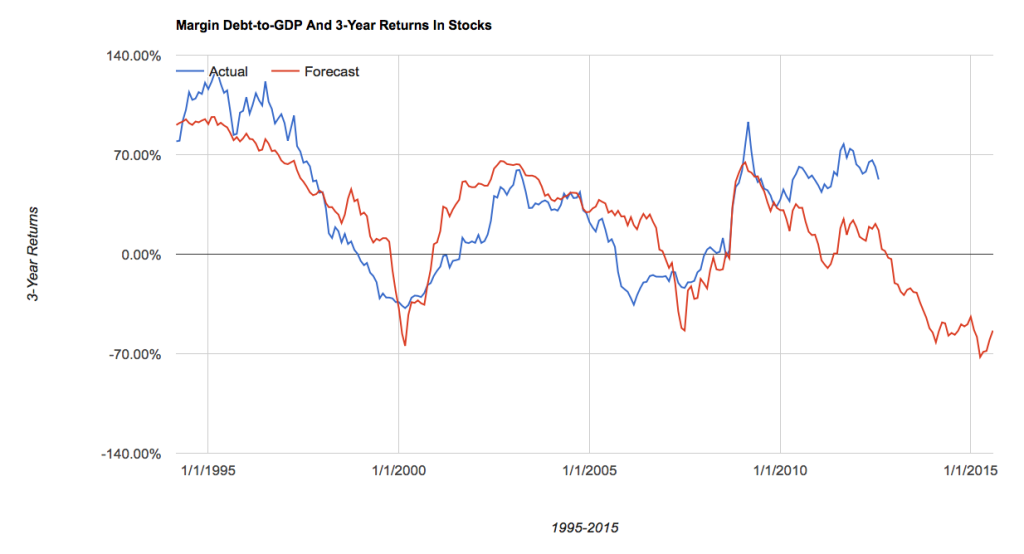
What’s more, this measure of margin debt-too-GDP has had a very high negative correlation to future 3-year returns in stocks over the past 20 years or so. When levered financial speculation as a percent of overall economic activity rises above 2.25% returns over the coming 3-years have been sharply negative.
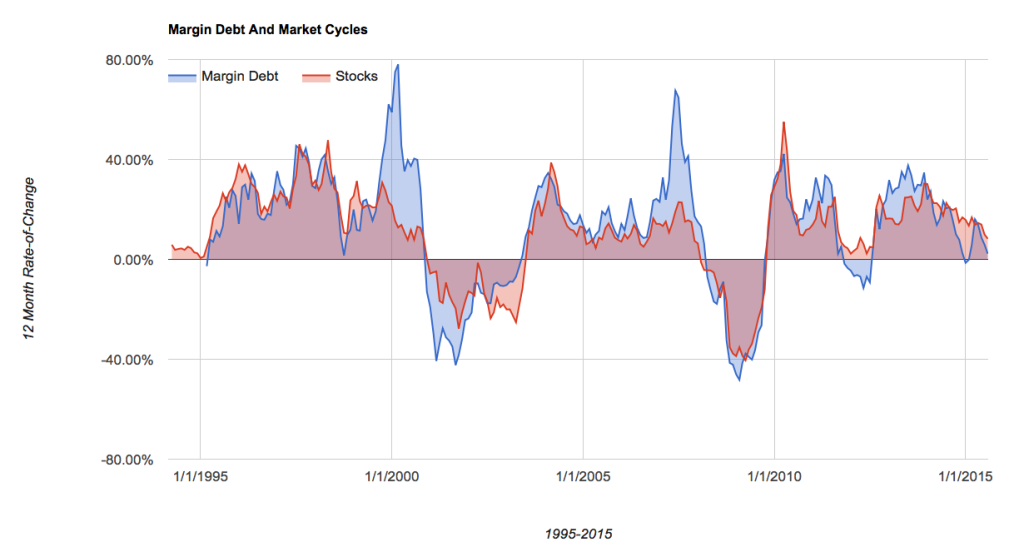
What concerns me the most today is that after recently reaching this high-water mark, the annual rate of change for margin debt turned negative back in January of this year. It rebounded as the market went on to make new highs in May but looks as if it’s likely to turn negative again this month or next. This is important because the 12-month rate of change in margin debt is very highly correlated to the 12-month rate of change for the stock market.
The prior two bear markets began under very similar circumstances. In December of 2000 and April of 2008, margin debt as a percent of GDP peaked over 2.25% and the 12-month rate of change turned negative. In other words, levered financial speculation reached a very high level and then reversed course. In 2000 and 2008, this was a good sign that the bull market had ended and a new bear market was underway. And that’s exactly what we are seeing again right now.
Take a quick glance again at that first chart above and you’ll begin to understand why all of this should make you more cautious toward stocks right now. When widespread levered speculation reverses course like this it can lead to sharply negative 3-year returns.
That said, we only have a couple of prior occurrences to go on and history doesn’t repeat itself, even if it does rhyme. Still, it usually pays to “take the market’s temperature” in this way, as Howard Marks likes to say:
As difficult as it is to know the future, it’s really not that hard to understand the present. What we need to do is “take the market’s temperature.” If we are alert and perceptive, we can gauge the behavior of those around us and from that judge what we should do… Simply put, we must strive to understand the implications of what’s going on around us. When others are recklessly confident and buying aggressively, we should be highly cautious.
Margin debt is telling us that if there’s any time to be “highly cautious” it’s right now because, if the past two cycles are any guide at all, there’s a very good chance we are witnessing the early stages of a new, major bear market.
Copyright © The Felder Report


