Large daily gains occur along downtrends and they are often bull traps
by Michael Harris, Price Action Lab
Large gains in excess of 2.5% occur primarily during downtrends and they cause short squeezes and bull traps. Thus, those participants that affect these large changes know what they are doing. A backtest reveals the risks faced by bulls.
For the purpose of this analysis only, a downtrend is defined by the following condition:
close < 200-day moving average
and an uptrend is defined by:
close > 200-day moving average
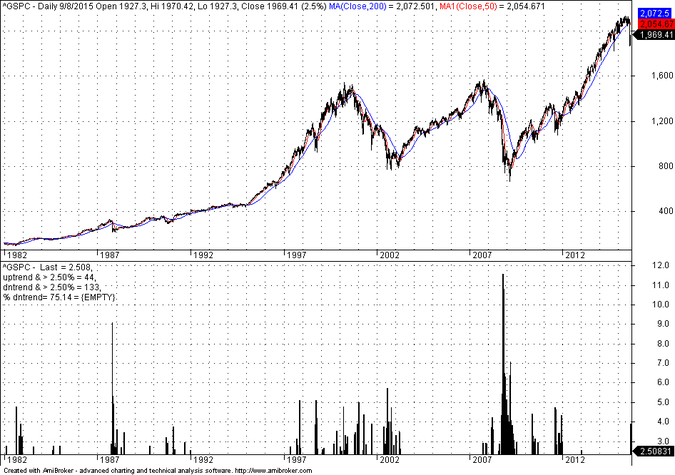
The first chart shows daily changes of more than 2.6% in SPX since 1960 during uptrends and downtrends in the sense of the above definitions:
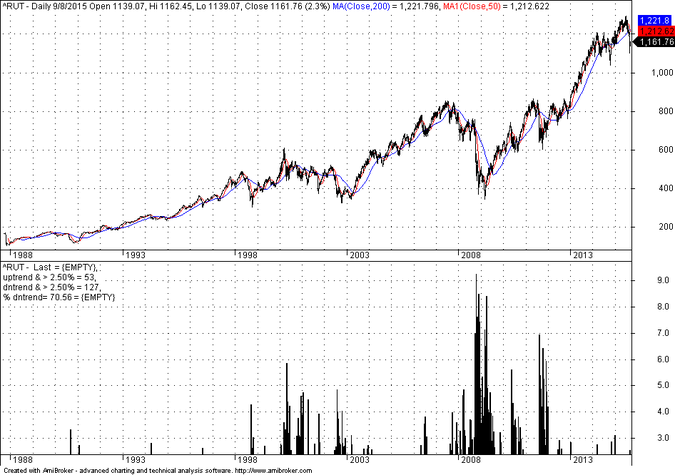
It may be seen that 75.14& of daily gains of more than 2.5% have occurred along downtrends. In Russell 2000, with data since 1987, 70.56% of daily changes of more than 2.5% have occurred in downtrends.
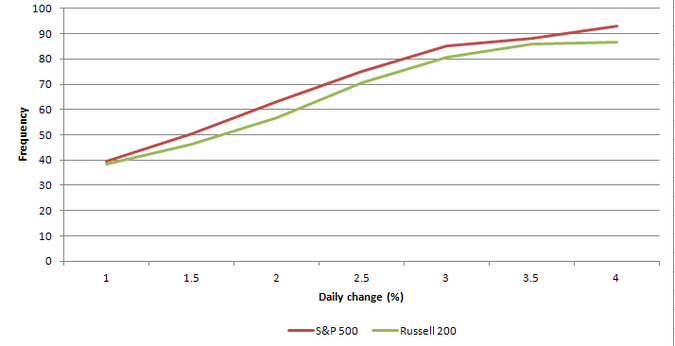
Below is a chart that shows the frequency of daily changes of 1% to 4% in increments of 0.5% for S&P 500 and Russell during downtrends:
As the daily change magnitude gets close to 4%, the frequency increases, 92.86% for S&P 500 and 86.79% for Russell 2000.
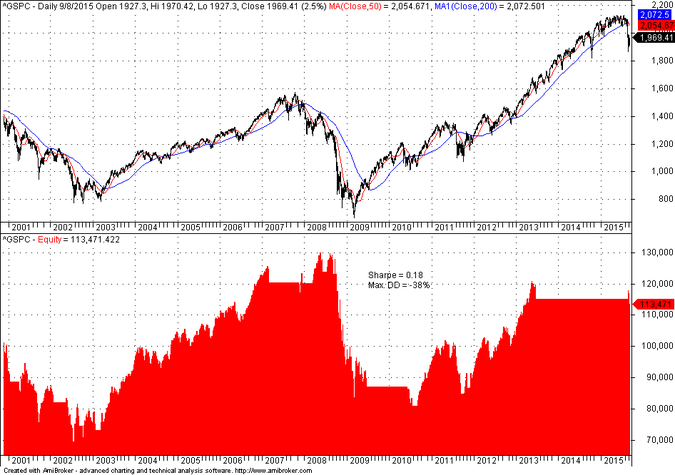
Below is a backtest in S&P 500 with data since 01/2000 of a system that buys on the close of a +2.5% day during a downtrend and exits at the close of a -2.5% day:
Maximum drawdown is about -38% and Sharpe is only 0.18. This is a bull trap, as it may be seen from the sharp decline in equity during the 2008 bear market.
Conclusion: During times of uncertainty some will try to entice others to make the wrong move. Regardless of direction, they will pocket the money. So, in my humble opinion, in times of uncertainty it is better to stay away from the markets.
You can subscribe here to notifications of new posts by email.
Charting program: Amibroker
Disclaimer
Detailed technical and quantitative analysis of Dow-30 stocks and popular ETFs can be found in our Weekly Premium Report.
New book release

Publisher: Michael Harris
Date: September 1, 2015
Language: English
270+ pages (6″ x 9″ trim)
74 high quality charts
Available online only
Table of Contents
© 2015 Michael Harris. All Rights Reserved. We grant a revocable permission to create a hyperlink to this blog subject to certain terms and conditions. Any unauthorized copy, reproduction, distribution, publication, display, modification, or transmission of any part of this blog is strictly prohibited without prior written permission.


