Consulting our technical playbook
by Burt White, Chief Investment Officer, LPL Financial
KEY TAKEAWAYS
· In challenging market environments, technical analysis tools can help us make better investment decisions.
· Our technical playbook suggests recent market weakness may present a buying opportunity.
· We are mindful of risks that might impact our playbook, including a potential China hard landing or a central
bank policy mistake.
When markets are tough, emotions can take over. The natural emotional response to sharp stock market declines is to sell. In periods like these, especially when the media sensationalize every gloomy angle as they tend to do, an objective look at the data can be reassuring and help us make better investment decisions.
Like analyzing statistics to assess the outcome of a football game (this week does mark the beginning of the NFL season), the stock market gives us a lot of data over many decades to help us make good investment decisions when our initial emotional reaction might be to call a time-out and sell stocks. History gives us our playbook — so no matter what the environment (or who the opponent), we should have a good idea of how to respond and what play to call. We won’t always be right, but we can seek to stack the odds in our favor and increase our chances of gaining yards while limiting fumbles.
This week we take a technical, data-driven approach to assess the likelihood that the current market decline (now about 10% from the May 21, 2015, S&P 500 peak) becomes something worse.
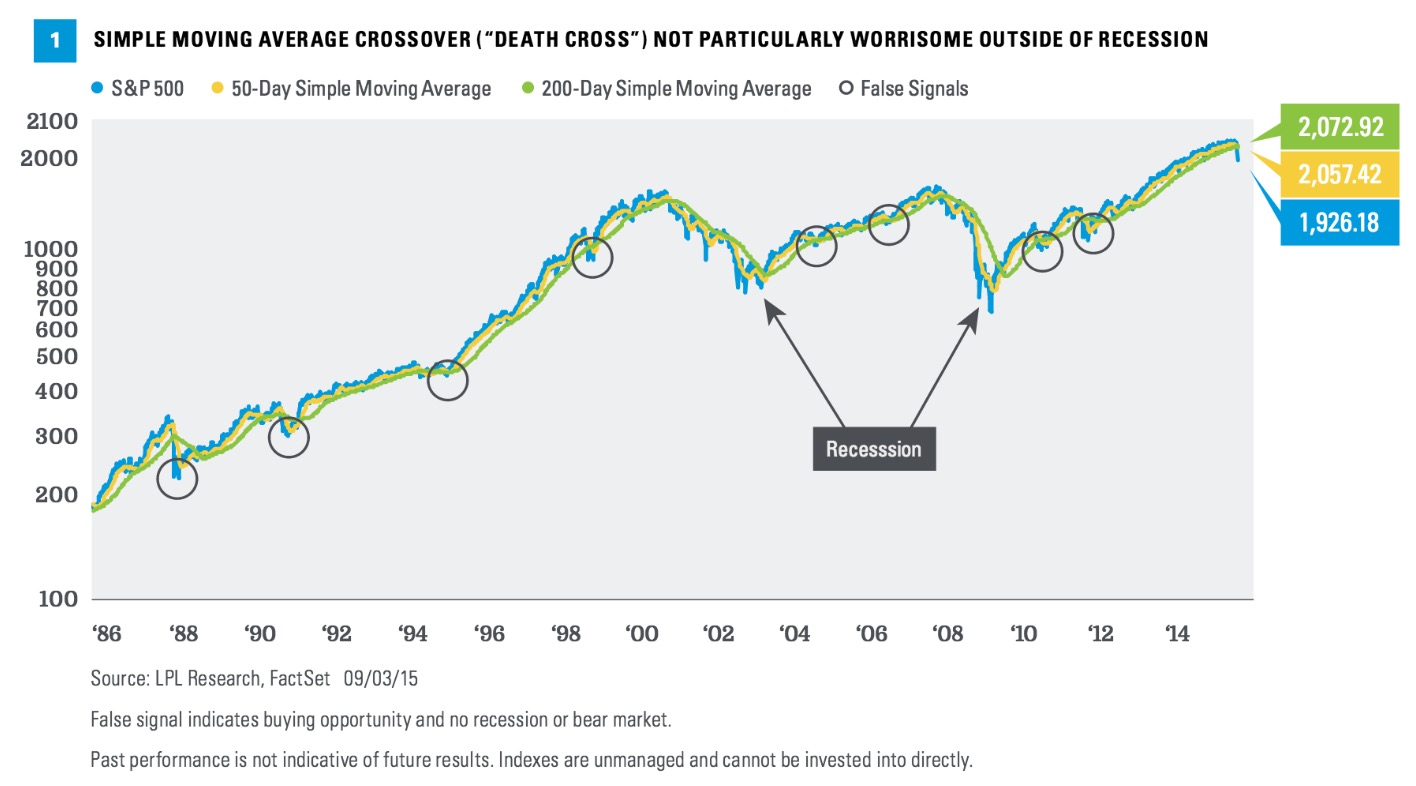
THE DEATH CROSS
The media love to talk about the death cross. This uplifting term describes when an index’s shorter-term moving average falls below its longer-term average. The most often cited indicator is when the 50-day simple moving average crosses under the 200-day simple moving average, something that the S&P 500 experienced on August 28, 2015 [Figure 1]. This condition reflects the loss of short-term upward momentum for the stock market and is seen as a warning sign of more trouble ahead. Does this signal provide a warning worth heeding?
A simple, or arithmetic, moving average is calculated by adding the closing price of the security for a number of time periods and then dividing this total by the number of time periods. Short-term averages respond quickly to changes in the price of the underlying, while long-term averages are slow to react.
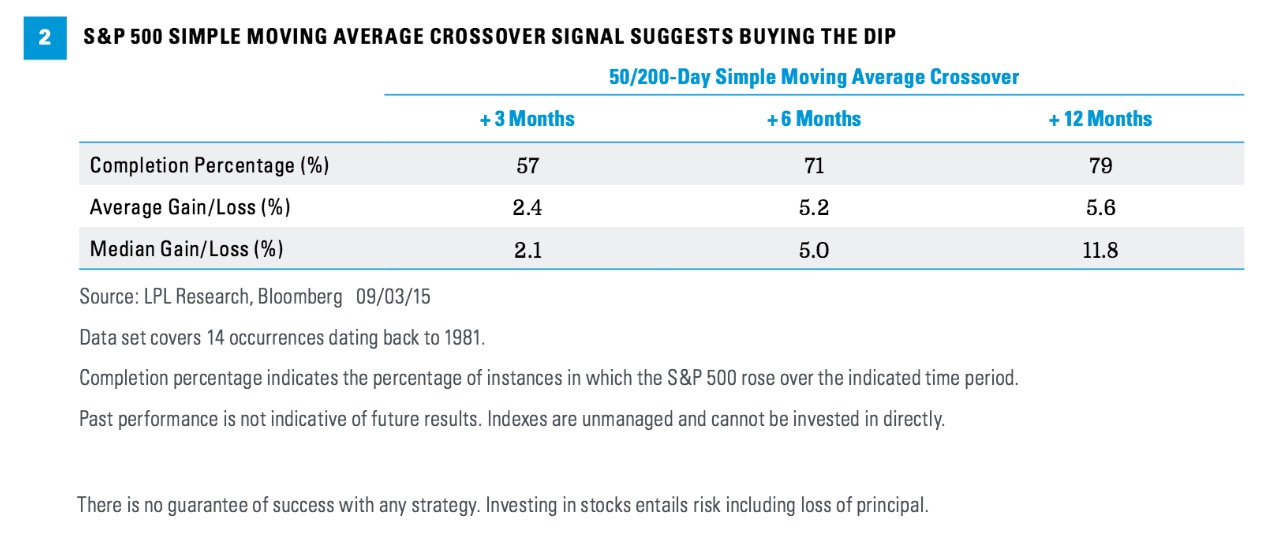
Here the data provide useful perspective. As shown in Figure 2, over the past 35 years, the S&P 500 has experienced 14 of these crosses. More than half the time (8 instances), the S&P 500 was higher 3 months later, with an average gain of about 2%. The numbers get a little better when you go out 6 months, with gains in 10 out of 14 instances, and an average gain of about 5%. Over 12 months the numbers are even better, with stocks down a year later only in recessions. Given the false signals this indicator may give, the playbook for this one seems to indicate to buy the dip.
There is no guarantee of success with any strategy. Investing in stocks entails risk including loss of principal.
CAPITULATION?
The term “capitulation” gets thrown around a lot when stocks are down sharply. The technical definition is to surrender, or throw in the towel. In terms of markets, it essentially means that heavy selling has (in theory) left no one else to sell based on current catalysts. We would suggest that on August 25, 2015, when the S&P 500 reached its closing low for the year at 1867, stocks demonstrated a fair amount of capitulation. Heavy volume is one piece of evidence, reflecting many investors exiting the market all at once.
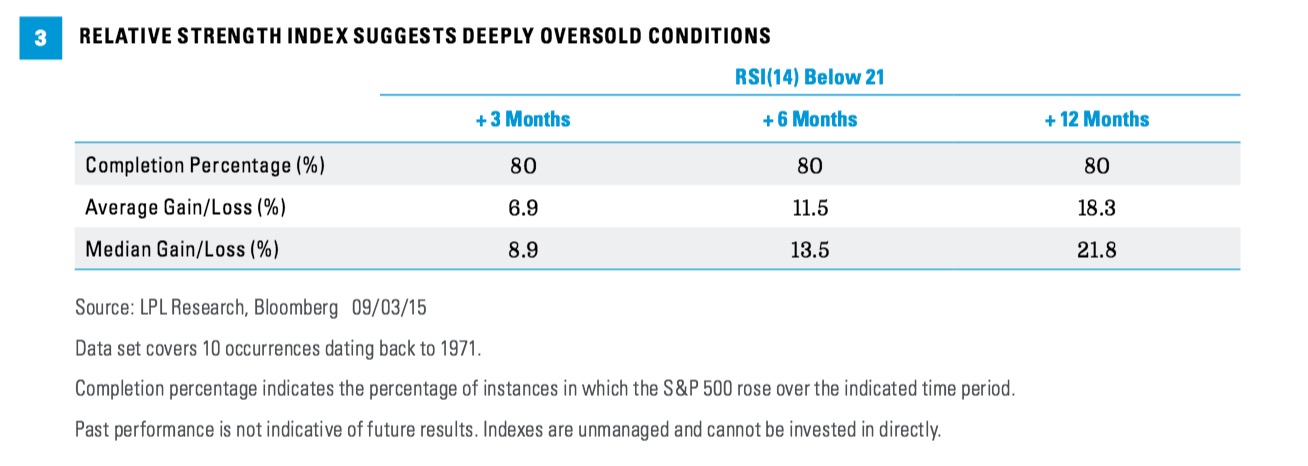
The Relative Strength Index (RSI) is another way to assess capitulation by measuring the depth of oversold conditions. A higher frequency of steep declines over a period (in this case we use 14 days) coincides with a low RSI. Based on historical data, when the daily RSI (14) closes below 21 — a level broken for the S&P 500 on August 24 — it suggests the start of a potential short-term bottoming process and increases the potential that stocks move higher.
The data presented in Figure 3 make what we believe is a compelling case for a potential opportunity to buy the dip. The gain in the S&P 500 following RSI(14) breaks below 21 are, on average, about 7% just 3 months later, 11% 6 months later, and 18% 12 months later. This indicator also has a good “completion percentage,” with 8 of the 10 instances seeing stocks higher 3, 6, and 12 months after reaching this extreme oversold level. Again, this playbook seems to indicate to buy the dip.
DETERIORATING BREADTH
Market breadth essentially tells us how many stocks are participating in a market rally or decline and can be measured in many ways. Breadth can tell us how broad a rally is, which indicates how durable that rally may be. One way to measure breadth is the advance-decline line, which measures the number of stocks advancing versus the number declining (one of the Five Forecasters we have cited in many prior publications). In a market decline such as the one we are experiencing now, a measure of breadth that has a good track record of signaling market turnarounds is the percent of S&P 500 companies trading above their 50-day simple moving averages.
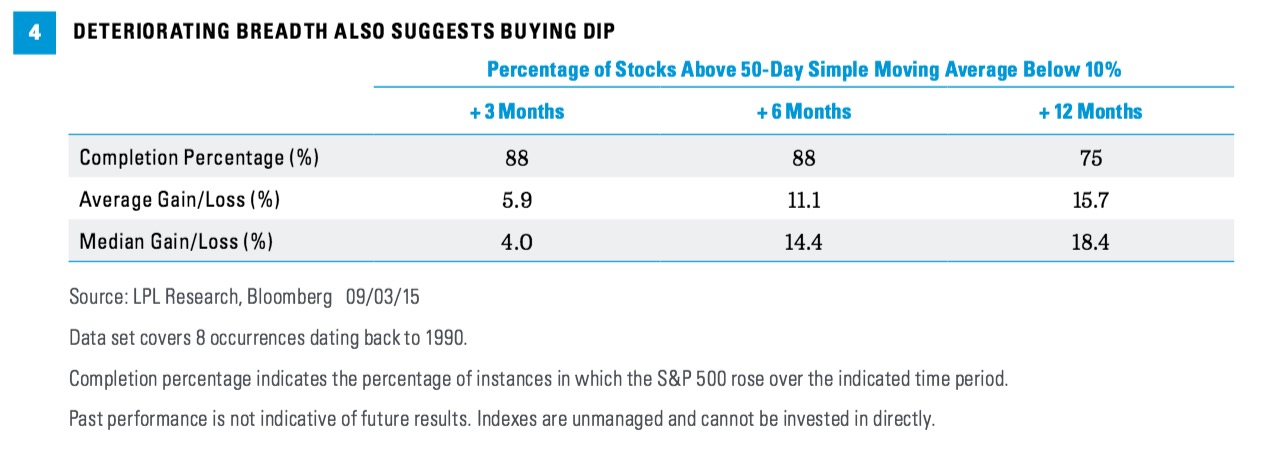
Historically, when only 10% of companies (or fewer) are trading above their 50-day simple moving average, the market is considered extremely oversold, which supports the start of a short-term bottoming process and a fairly high potential for stocks to move higher. Figure 4 shows that over the past 25 years, when so few S&P 500 stocks are in short-term uptrends, the S&P 500 is, on average, 11% higher 6 months later (and up 7 out of 8 times) and nearly 16% higher after 12 months (and up 6 out of 8 times). If recessionary periods are excluded, stocks were higher during all observed periods — with even bigger gains. Again, this analysis provides no guarantee, but these favorable percentages can help provide some valuable perspective for those whose confidence may have been shaken by recent volatility. Here, another playbook seems to indicate to buy the dip.
Investor sentiment, a topic we discussed in last week’s Weekly Market Commentary, “12 Questions for a 12% Correction,” is another way to identify oversold conditions, or capitulation. The American Association of Individual Investors (AAII) investor survey indicates that individuals who were bullish on the stock market were as hard to find in August 2015 as they were during the darkest days of the 2008 – 2009 financial crisis. Historically, this heightened level of investor pessimism has indicated a potential contrarian buying opportunity.
CONCLUSION
The natural emotional response to sharp stock market declines is to call a time-out and sell. In challenging market environments, technical analysis tools can help us make better investment decisions and limit fumbles. Historical comparisons to prior periods of similarly oversold conditions can help give us our playbook, which we believe suggests investors, where appropriate, may be better off maintaining equity positions, rather than selling
into the latest decline.
Read/Download the complete report below, or here:
Weekly Market Commentary 09082015
Copyright © LPL Financial