by Jeffrey Saut, Chief Investment Strategist, Raymond James
Good to hear from you! Yes, for the last year and a half or so the construction market has been rebounding very well for the commercial sector. The heavy industrial sector is also in a very good upswing that is if the oil prices don’t keep going down. Currently on the Gulf Coast there is $260B of work for chemical plants, refineries, plastics and processing plants that is funded on the books and is breaking ground or going to break ground between now and 2017. The industrial food sector is pretty hot also. We just had several contractors that finished up several $1B yogurt plants, who would think yogurt was that big. The housing sector is also on the verge of exploding; however that’s a mixed market. Anything from garden style apartments to high rise, the rental market is still pretty hot. Independent mortgage sales are picking up pretty steadily, but rental is still king so far as we are putting in sprinklers. All this info is from our 700+ contractors that we do business with. I am in Vegas right now and it is starting to turn around also, not like it was 7 years ago but it too is on an upswing.
. . . Business manager of a sprinklers company that does work nationwide
We begin this morning’s strategy report with the aforementioned quote from the business manager of a large commercial sprinkler company, which has 700+ plus contractors nationwide, because his comments are always a good “window” on the economy. To be sure, nothing really big is ever built without a sprinkler system. I also include said quote because there has been much talk over the past few months of slowing economic statistics telegraphing an impending recession. Manifestly, we do not believe it! In fact, one can make the argument the U.S. economy is actually growing at roughly a 3% GDP growth rate, even though the government’s official figures belie that. A 3% GDP growth rate indeed for last week’s ISM Non-Manufacturing Index (Institute for Supply Management) was reported much stronger than expected. As my friends at the invaluable Bespoke organization wrote:
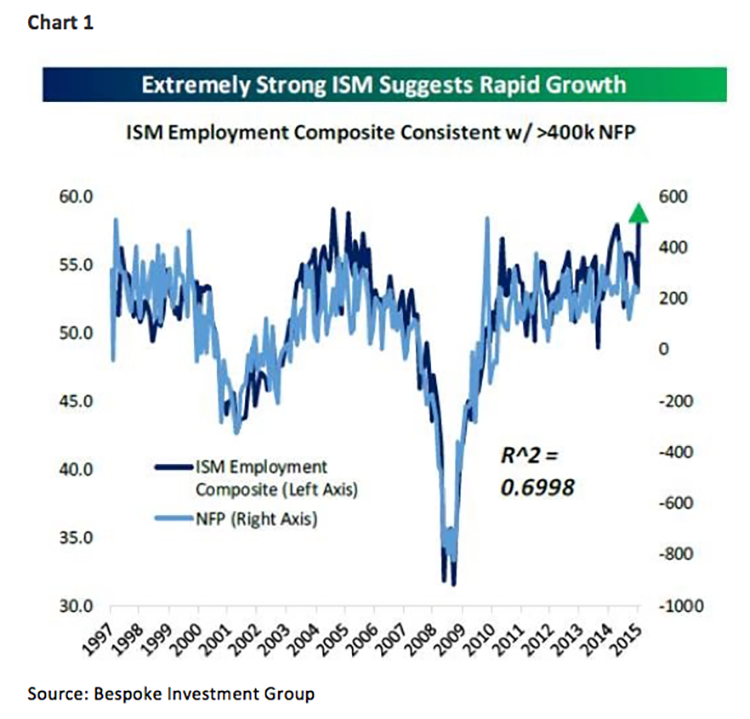
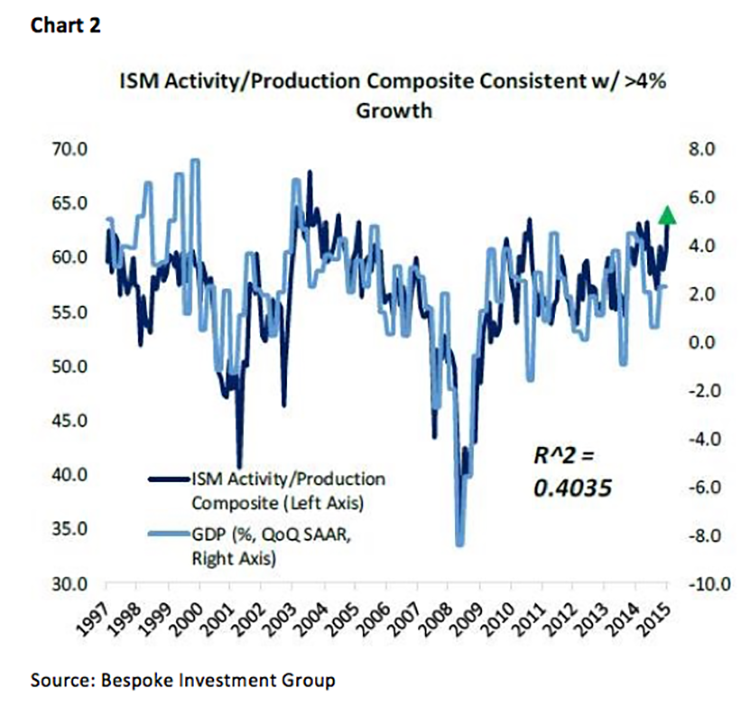
(Wednesday’s) ISM Non-Manufacturing release blew the doors off expectations, with the composite indicator printing 60.3 (the best since 2005) versus 56.2 expected and 56.0 previous. (On page 3) we show charts combining sub-indices of both ISM Manufacturing and ISM-Non-Manufacturing to get a ‘real-time’ indicator of both employment growth and total economic growth.
Within the ISM report new orders leaped 5.5 points (to 63.8), which is also a 10-year high, and backlogs grew 3.5 points (to 54), while the employment index spiked +7 points to 59.6. Yet, it is not just the ISM report that is showing things are getting stronger. Hereto, Bespoke chimed in by writing:
(Last week) was a pretty good week for economic data, with a solid Employment Situation Report, strong auto sales, a bump up in consumer credit, a blowout ISM Services report, and pretty decent manufacturing data. While Construction Spending missed, there were big upward revisions to the prior months’ data, and while consumer spending didn’t blow the doors off by any means, it was at a healthy pace.
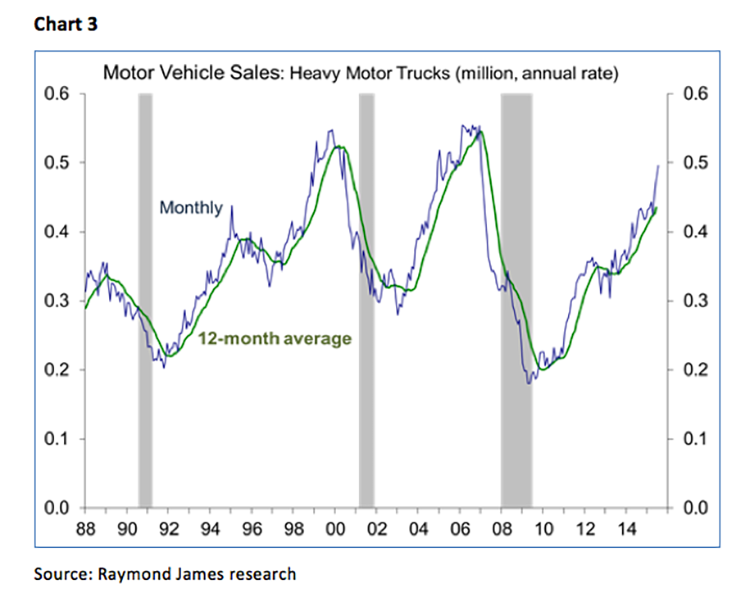
Additionally, total vehicle sales tagged 17.5 million (seasonally adjusted annual rate) last Monday, which was the third month in a row of more than 17 million for light vehicle sales. However, the report that really caught our eye was Heavy Truck Sales, which at +4.2% in July, have surged (see chart 3 on page 4). July’s heavy truck sales report was the strongest selling pace since December 2006. Remember that sales of heavy trucks imply companies expect to ship more products in the months ahead. It also “foots” with our theme of energy efficiency since new trucks are much more fuel efficient than our existing aged fleet. Mortgage applications rose by 3.3% week-over-week and by 23.2% year-over-year, refi applications improved by 5.9% w/w and 8.1% y/y, Markit’s Chinese PMI services report rose 2 points month-over-month (to 53.8), ditto India’s PMI services’ index rose back above 50 (to 50.8), and the list goes on. Ladies and gentlemen, these are not the kind of reports you get if the economies of the world are descending into recession.
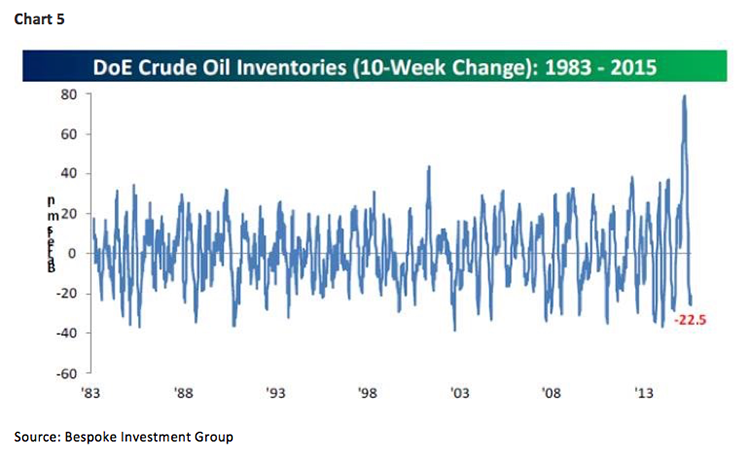
Despite such strengthening figures the recession rascals continue to scream about the crashing commodities (chart 4), and all of the deflationary ramifications, with crude oil being the most “vocal.” While it is true rude crude has declined some 30% from its May 6th high of $62.58 per barrel into last Friday’s intraday low of $43.70, we continue to think crude oil bottomed in March at $42.03. Part of that belief is based on the recent drawdown of inventories. Clearly after a record build, inventories are still elevated on a historic basis, but we have seen a large drawdown in stockpiles over the past 11 weeks (chart 5). Further, crude oil demand continues to increase on a worldwide basis, according to BP Energy. Then too, Saudi Arabia is having troubles due to the low oil prices, for as Bloomberg writes:
Saudi Arabia’s reserves have shrunk for nine out of the last 10 months as the oil-price rout, war in Yemen and a boost in domestic spending pressure state finances. The International Monetary Fund forecast that the kingdom will post a budget deficit this year equal to 20 percent of its GDP.
Accordingly, it is going to be interesting to see what happens to oil this week. While it may be heresy to mention a master limit partnership (MLP), given the ongoing carnage, many times out of crisis comes opportunity! Remember, midstreams are “toll takers” with not much exposure to energy prices.
Equally as interesting as oil prices will be to see what happens to stocks this week as we approach the August 13th to August 18th timeframe that our models have targeted for a bottom since the second week of July, when our measurement indicators showed the stock market’s internal energy was totally used up. Also of interest is that while the S&P 500 (SPX/2077.57) is within 2.7% of its all-time intraday high, many stocks have been shellacked. According to my pals at the astute asset management firm of Day Hagen (I own their mutual fund):
The U.S. equity markets continue to evidence deterioration beneath the surface. For example, based on the largest 4000 publicly traded companies on U.S. exchanges, more than 45% of those companies, or 1,804 of them, are 20% or more below their 3-year highs. Furthermore, 24.09% of those 4000 companies are 40% or more below their respective 3-year highs (we use 3-year highs to eliminate misleading short-term spikes that could skew results).
Both Andrew Adams and I have written about this phenomenon, suggesting what we may be experiencing is an “internal” correction in “time” rather than a larger correction in “price” since many stocks are down 20% or more from their respective three-year highs. Also worth mentioning, as we approach our timing point for a potential bottom, is that while the short-term NYSE McClellan Oscillator is not oversold, our proprietary longer-term overbought/oversold model is pretty oversold.
The call for this week: “You're traveling through another dimension, a dimension not only of sight and sound but of mind. A journey into a wondrous zone whose boundaries are that of imagination. That's the signpost up ahead – your next stop, the Twilight Zone!” Except in the current case, that signpost up ahead is our potential targeted “buy zone” of August 13th – August 18th. Surprisingly, of all the indices I monitor only the D-J Utility Average (UTIL/590.45) rose last week. In fact, the only indices that have not broken down in the charts are: UTIL, SPX, NDX, COMP, and the MID. This morning, however, the preopening futures are higher spurred by hopes China’s grim economic data over the weekend will cause more Chinese stimulus. Then too there is news of a final push to seal a Greek bailout deal. I think we are very near a bottom. And that’s the way it is as I paddle out into the Gulf of Mexico here at Lido Beach. Obviously, there will be no verbal comments . . .
Copyright © Raymond James


