by Jeffrey Saut, Chief Investment Strategist, Raymond James
In “Parsons Pleasure,” a short story by Roald Dahl, a greedy London antiques dealer dons a clerical collar, drives to the country, parks his car, and walks from cottage to cottage requesting old furniture, under the guise of collecting for the Society for the Preservation of Rare Furniture. His mission, of course, is to winkle the bumpkins out of treasures they don’t know they have. He can scarcely believe his luck when he is promised a chest worth thousands of pounds. He buys it for a song, saying he wants the legs and dismissing the rest as firewood. He fetched his car and drives back to find that his benefactors have carefully removed the legs and chopped the chest into firewood.
. . . “Winkling the Bumpkins and Other Tales of Greed”, Patricia O’Toole, Lears, March 1992.
Greed is always hard to measure. Certainly we have seen some signs of it in the Big Bio-Bubble and the new issue market. Putting the latter into perspective is Michael Milken, who was featured in an exclusive cover story interview in the March 16, 1992 issue of Forbes:
The stock market is certainly voracious today for stock offerings. It’s beginning to look like the 1960s again. Or 1983 or 1986. These times don’t go on forever. Anyone who isn’t selling equity today should have his head examined. The window is WIDE open. Window? It’s the Grand Canyon.
Many of his observations rang true back then and they ring true today as well. Milken goes on to note:
I have often been told, “You keep harking back to 1974. You were just a kid!” I was 100 then. I’m 200 now. The year 1974 taught me that leverage can decimate even the best company when its access to capital is cut off. It also taught me that most people have short memories. That’s why most financial people have five-year careers; one market cycle. All those geniuses who bought stock in the mid-1960’s thought they had some divine touch then it all stopped. It hadn’t occurred to them that they looked good because virtually everything was going up. In 1983 Drexel published a paper called “The $55 Billion Misunderstanding.” That’s how much was lost by people following Nifty Fifty growth stocks. It was a trend, and trends end.
Wow! Do I remember the 1974 period. From the bull market top on January 11, 1973 at 1051 . . . all the way down to December 6, 1974 at 577. Ugly, and awful for almost two years with every rally a trap set up by the bears. Day after day the market went down. It seemed as if it would never end. As Jimmy Wheat Sr., of Wheat First Securities, would say, “We are being pecked to death by pelicans!”
Listen to Peter Lynch in the January 20, 1992 Barron’s “Roundtable:”
LYNCH: Taco Bell went from $9 to $1 in 1974. They made money and they never had a down quarter. I mean, you get one of these big drops in these overpriced stocks, like you had in ’87, in ’74; you get one of these major corrections of these growth stocks and everything goes down.
Or, listen to John Boland in a November 1990 issue of Warfield’s “Easy Money” Column:
Anyone who was active in the market through the 1973-74 collapse will remember that at the bottom, when the process were at once-in-a-lifetime lows, buying stocks held scant appeal. Reasons for shunning the bargains were abundant. The days when people made money in stocks were gone. The economy was in a bucket going to hell. If you bought stocks today, you would lose money – because you had lost money every time you bought stocks in the last two years.
. . . Back in 1974, (our friend) had a favorite stock, with about $15 (per share) in cash in the till, a book around $20. He started buying at $10 (and) bought it down to $6 and change. The shares sank to $3.75, but my friend was out of money. That’s a bear market. The bulls aren’t just morally beaten. They’re broke.
. . . The bleak mood has a tenuous bridge to reality. Perception, intensely felt, creates minor reality. A trader, brutalized for every optimistic thought he has, stops having them and drops out of the market. The absence of his bids causes prices to fall further. This feeds on itself only for a time, but while it does, anyone stuck in the stock market would be much happier sitting in T-Bills in Acapulco.
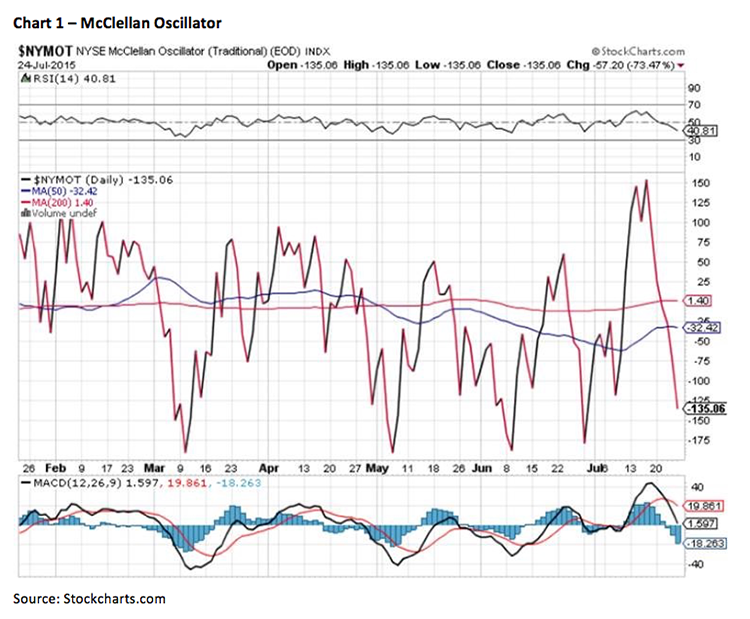
The bear market that ended in December 1974 did such damage to investor psychology that it wasn’t until the mid-‘80s that stock ownership became chic again. And, a number of weeks ago the “window” was wide open again with a plethora of IPOs and new ETFs. Yet we were writing, at the time, the stock market’s internal energy is TOTALLY used up on a short-term basis, leading us to believe a trading top was at hand. We wrote, “Either the SPX will fail to make a new all-time high, or make a marginal new all-time high, before succumbing to a pullback.” Clearly, the anticipated “pullback” is at hand, leaving current investor psychology just about as bleak as it gets, which is pretty amazing with the S&P 500 (SPX/2079.65) only 2.6% below its intraday all-time high! Still, as expected the 2110 – 2112 level didn’t hold, and neither did the 2090 – 2100 level. In fact, in Friday’s Fade the SPX decisively closed below its 50-day moving average (DMA) of 2102.26, bringing into view its 200-DMA at 2063.64. With the NYSE McClellan Oscillator vastly oversold on a short-term basis (see chart 1 on page 3), it would not surprise to see a rally attempt off of the 2050 – 2065 level. Quite frankly, however, I think that 2050 – 2065 zone eventually gives way to a more formidable pullback to the 2020 – 2030 level, and maybe as low as last December’s lows of 1970 – 2000. In response to one of our financial advisor’s questions of how will you know when we bottom, I said, “It’s kind of like pornography, you will know it when you see it!” I will say, however, the selling in the energy complex borders on capitulation, as do commodities in general!
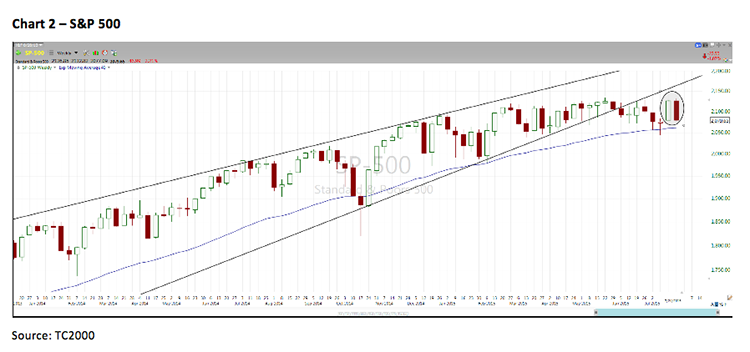
The call for this week: The NASDAQ has failed to sustain a breakout to new decisive all-time highs seven times recently. I don’t know the precedent for that, but I will bet it is legion! Moreover, there were 33 “buying climaxes” on the SPX last week, the most since last March’s short-term “Trading Top;” as well, the SPX also experienced the candle-stick chart pattern of a “bearish” engulfing pattern last week (see chart 2). Accordingly, we have been in “correction mode” for the past few weeks: and, we still feel that way even if we get an oversold “throwback rally” in the short run. Indeed, 10% corrections tend to occur about every 26 months, yet it has been 45 months since the last 10% correction. And, the three previously longest such periods led to 10% pullbacks. I don’t know if that is the case here, but it sure was in China overnight as shares fell an eye-popping 8%! Of course that has our preopening S&P 500 futures off around 6 points as the sun rises over Vanderbilt University here in Nashville Tennessee. Firewood anyone?!
Copyright © Raymond James


