


Inflation Holds the Key for P/E Multiples
by Jim Paulsen, Wells Fargo Capital Management
Will price/earnings (P/E) multiples rise further in this recovery cycle? Or, are valuations already near a recovery peak representing a risk for investors should they contract and making future stock returns increasingly dependent on good earnings performance?
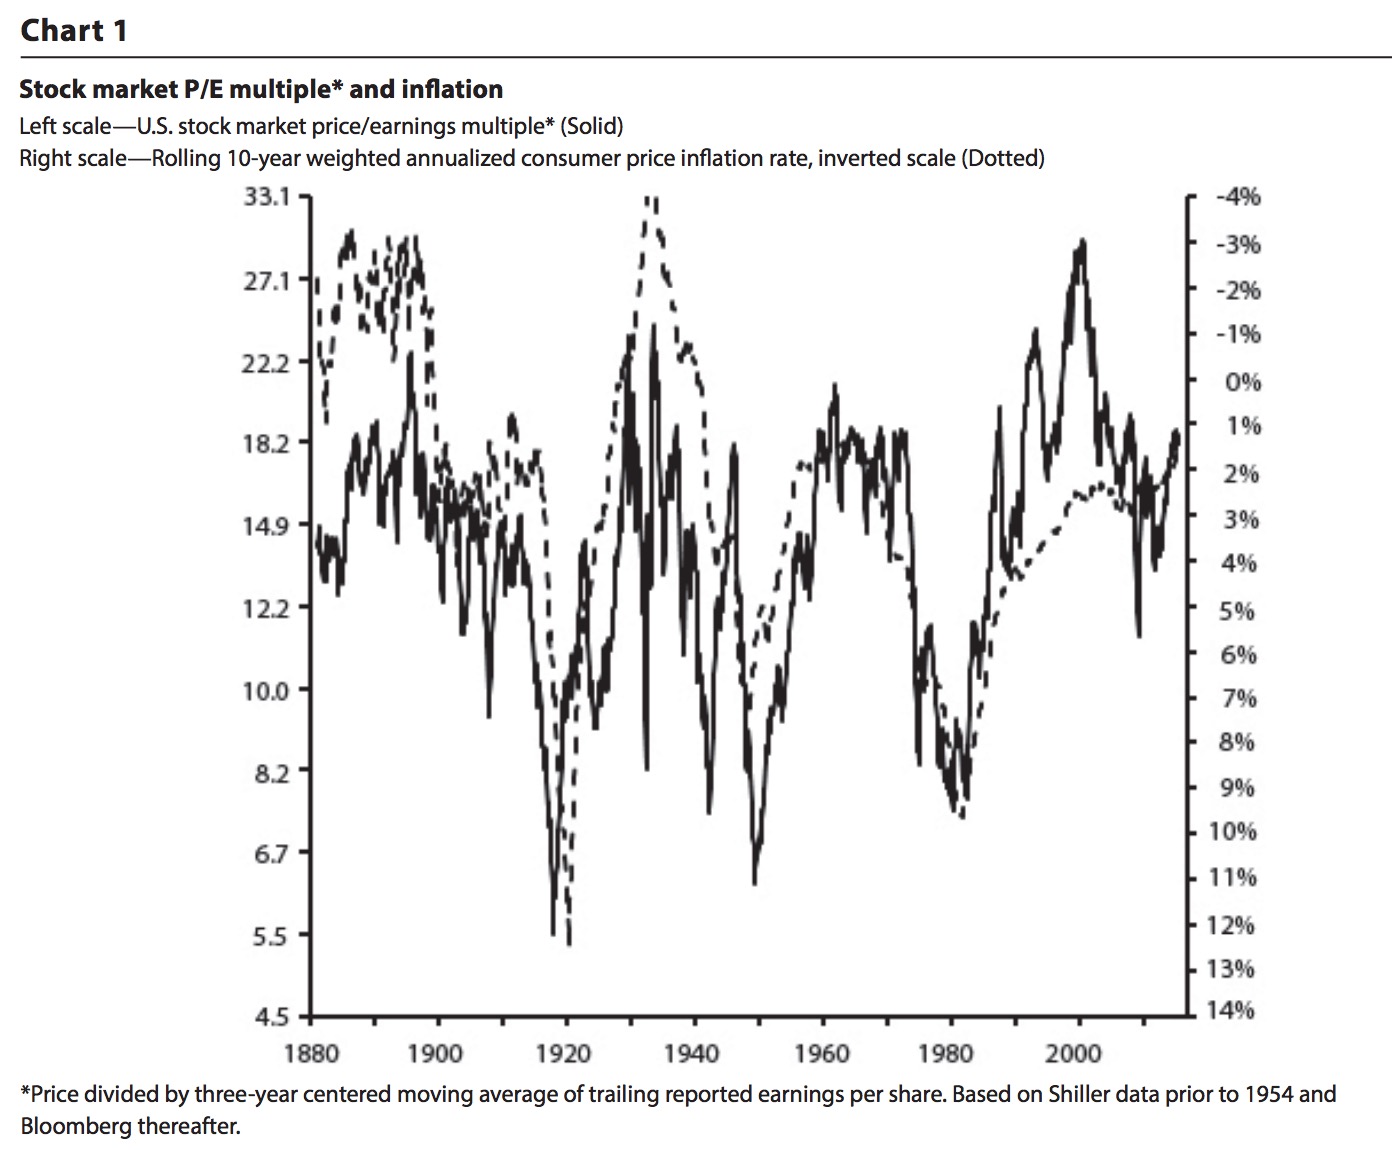
The accompanying chart, illustrating 135 years of U.S. financial history, suggests the valuation of the stock market depends mostly on what happens with the inflation rate. The solid line is the stock market’s P/E multiple based on a centered three-year earnings per share (i.e., an average of trailing 12-month earnings per share during the last 18 months and the next 18 months). The dotted line characterizes the inflation environment. It is a trailing 10-year weighted average of the annual consumer price inflation rate (shown on an inverted scale so lower (higher) inflation rates are shown by a rise (decline) in the dotted line). Examining the historic relationship between inflation and P/E multiples is helpful in accessing the risk-reward profile of today’s stock market.
Historical Observations
Although the P/E multiple and the inflation environment have not moved perfectly together, they have been closely linked throughout much of U.S. history. A few observations are noteworthy.
First, the current year inflation rate does not correlate closely with P/E multiples. Rather, inflation expectations or the perception of the inflation environment appears more important in establishing P/E multiples and inflation expectations are probably formed mostly by past experience (i.e., a weighted average of the last decade inflation experience).
Although P/E multiples are more volatile than inflation expectations, historically, they also tend to be grounded by slower forming inflation expectations. For example, while the P/E multiple oscillated throughout the 1960s, it tended to remain near the range suggested by the 10-year inflation rate average. Similarly, even in the 1980s and 1990s, while the P/E multiple did rise a few times significantly above the level suggested by inflation expectations, it typically returned back to this range within a few years. Moreover, the P/E multiple has not “sustained” a major change without inflation expectations also experiencing a significant and lasting change. For example, a major rise in inflation expectations led to a sustained decline in P/E multiples during the late 1890s into the early 1900s, during the WWI inflation in the 1910s, during the inflation spiral associated with WWII in the 1940s, and the Vietnam War inflation fallout between the late 1960s through the 1970s. Likewise, major stock market valuation enhancements occurred because of significant declines in inflation expectations. Examples include the 1880s, 1920s, 1950s-1960s, and 1980s-1990s. Again, while the relationship between P/E multiples and inflation expectations is not perfect, it is amazing how closely and consistently the inflation environment has traced stock market valuations for more than 135 years. That is, when accessing the prospects for P/E multiples during the balance of this recovery, the focus should be on what may happen to inflation expectations.
Second, deflation has not been bad for stock market “valuations.” Although deflationary eras usually harm earnings and therefore are often associated with bear markets, P/E valuations commonly remain high during major deflationary episodes. For example, despite almost continuous deflation between 1880 and 1900 (i.e., the 10-year weighted average inflation rate hovered about minus 2%), the stock market’s P/E multiple remained close to historic highs during the period. Similarly, despite the Great Depression deflation in the 1930s, the median P/E multiple during the decade was about 16 times earnings. Deflation may be bad for earnings and thus for the overall stock market but is not necessarily bad for P/E valuations.
Third, the valuation of the stock market seems to be upwardly bounded by inflation expectations. With only a few brief exceptions, the P/E multiple has seldom sustained much above 20 times. Indeed, since 1881, the stock market P/E multiple has only been above 20 about 8% of the time. Most of these were brief spikes in the P/E multiple above the upper bound of 20 due mainly to a dip in earnings (e.g., 1895 and a couple times during the Great Depression in the 1930s). In all other markets prior to 1990, the stock market P/E peaked at or about 20 times. It peaked slightly above that in 1962 and right at 20 times in 1987. Since 1880, the only exceptions to the upper valuation bound of about 20 times earnings occurred twice during the 1990s. As shown in the chart, the P/E multiple spiked in 1987 (then only to about 20), 1993 (to about 24) and in 2000 (to about 30). While the valuation spikes in 1993 and 2000 were both historically unprecedented, like the spike to 20 times in 1987, both returned back below 20 times fairly quickly. Moreover, in all three of these cases, inflation expectations (dotted line) were still slowly adjusting lower. Perhaps in these cases, the valuation of the stock market simply got ahead of the actual improvement in the inflation environment. Then periodically (e.g., in 1987, 1993, and in 2000) readjusted back toward the actual movement in inflation expectations.
The tie between the upper valuation bound of about 20 times earnings to inflation expectations can be seen by comparing the two scales in the chart. A 20 P/E multiple on the left scale is equal horizontally to about a 1% inflation expectation. Excluding the two major periods of deflation (late 1800s and in the 1930s), historically, the 10-year inflation rate average has bottomed near about 1% (e.g., in the early 1900s, in the 1960s, and again in the contemporary era). Essentially, the P/E multiple of the stock market trends toward maximum value (20 times) as inflation expectations head toward price stability (i.e., near 1%). If price deflation results, stock market valuations remain near maximal levels whereas if inflation rises above 1%, sustainable P/E multiples are lowered.
Finally, history shows the stock market can remain expensive for a long time. Indeed, the stock market has been expensive much more frequently than it has been cheap. As shown, super cheap stock markets have been rare since 1880, occurring only during signficant surges in inflation. This refl ects the fact that the U.S. inflation environment is usually conducive to high stock market valuations. Both low inflation rates and deflation tend to support high P/E multiples. Mostly, only bouts of high inflation cause stock market valuations to collapse and these have been rare in U.S. history. In isolation, an expensive stock market alone, therefore, is not reason enough to run from stocks.
Current Investment Implications?
What does the accompanying chart suggest about the stock market’s current valuation profile?
First, the current P/E multiple is slightly above 18 and the trailing 10-year inflation rate is about 1.6%. As shown in the chart, the valuation of the stock market is almost exactly where it should be based on its historic relationship to inflation expectations. We are not in a situation today like we were in the 1990s when the P/E multiple was extended relative to what was justified based on inflation expectations. Valuation risk was elevated in 1987, 1993, and 2000, for example, not only because the stock market was highly valued but also because it was priced aggressively relative to the inflation environment. Second, nonetheless, the stock market is currently at a high historic valuation. At 18 times earnings, the P/E multiple is almost 30% above the historic average and has only been higher than it is today about 19% of the time since 1880! Moreover, historic upper valuation bound of about 20 times earnings is only about 10% above the current valuation level. The P/E multiple could spike above the upper valuation bound like it did in the 1990s, but the long-run assumption for sustained valuation improvement is at best only about 10%. Consequently, reasonable current buy and hold return expectations have diminished significantly from earlier in this recovery and are increasingly reliant on estimates of solid earnings performance.
Third, the valuation of the stock market has been aided in the recovery by declines in inflation expectations. As the chart shows, the 10-year inflation rate has declined by about 1% in this recovery (from about 2.5% to 1.5%) helping to boost the P/E multiple toward 18. This is the first valuation enhancement in the U.S. stock market since the late 1990s. Will inflation expectations continue to decline below 1% in the next few years and perhaps push the P/E multiple still higher? Although possible, a continued valuation improvement due to even lower inflation expectations is unlikely. The annual core inflation rate is currently 1.7%, slightly higher than the 10-year average inflation rate. Without a further collapse in oil prices, the current rate of inflation should soon begin to exceed the 10-year average inflation rate. Therefore, inflation expectations are most likely to begin rising in the next few years creating downward pressure on stock market valuations. Alternatively, should inflation continue to decline, deflation anxieties will likely worsen and neutralize any valuation enhancement due to lower expected inflation.
Fourth, the stock market is at considerable valuation risk should inflation unexpectedly and significantly accelerate. For example, if the 10-year average inflation rate rose to 5%, based on the historic relationship illustrated in the chart, the P/E multiple would decline to about 12 or about one-third lower from current levels. Although this is unlikely in our view, it cannot be summarily dismissed given an economy nearing full employment and due to the unprecedented and massive monetary policy employed in this recovery.
Fifth, although inflation is likely to begin rising soon, it will most likely only accelerate modestly. However, even this could prove challenging for today’s highly valued stock market. Assume, for example, the Federal Reserve is finally successful in lifting core inflation above 2% while oil prices also recover a bit. If the overall inflation rate rises above 3% in the next few years, inflation expectations will slowly worsen. Even a rise in the 10-year inflation rate toward 2.5%-3% would lower the equilibrium P/E multiple to between 15 and 16.5. Indeed, since inflation expectations are so low today, any rise in the current inflation rate would stop inflation expectations from declining. This would finally end the favorable undertow of rising stock market valuations which investors have gotten use to in the last several years.
Finally, stock market valuations could just oscillate in the next few years. By the early 1960s, the stock market P/E multiple essentially peaked, but it would not finally collapse until the 1970s. The bull market continued in the 1960s even though the P/E multiple stopped advancing. This occurred because inflation expectations became stable at very low levels and the P/E multiple simply oscillated about a high equilibrium valuation level. However, the 1950s bull market, which was driven primarily by rising valuations (and falling inflation expectations) was much more robust compared to the stock market in the 1960s when P/E multiples stopped perpetually rising. Indeed, in the 1960s, investors did best by adjusting portfolio aggressiveness based on whether the P/E multiple was above or below its suggested equilibrium value. This approach may again prove successful today. If inflation rises only modestly in the next few years, the P/E multiple could enter another era of trendless oscillations. In this case, stock investors may consider adjusting equity exposure depending on whether the P/E multiple is closer to 16 or closer to 19.
Summary
This bull market has seemingly entered a phase where the valuation backdrop is no longer persistently positive. Based on history, the upside potential for further sustained valuation enhancement is only about 10%. Moreover, because the U.S. is nearing full employment, inflation is likely to soon begin rising. Consequently, even a mild acceleration in inflation may cause a 10%-15% contraction in P/E multiples.
Essentially, with the stock market P/E multiple now fairly high by historic standards, future stock market returns seem increasingly dependent on earnings performance. Since corporate profit margins are already near post-war highs, earnings results will mirror sales growth. However, since the economy is now nearing full employment, better sales growth may only come at the expense of higher inflation and lower P/E multiples.
While we still believe the contemporary bull market will most likely last several more years, we also expect the stock market to prove more challenging in future years. By historical comparison, we may have just left the best part of the bull market behind (i.e., à la 1950’s style P/E multiple-driven bull market) and are now entering a much less satisfying and more strategically difficult bull phase (à la more like the 1960s).
We continue to suggest caution in the intermediate term, expecting a correction may be forthcoming before we can sustain another solid and lasting rally. Like the 1960s, we think an approach which gets more aggressive as the market’s P/E multiple declines toward 16 and more defensive as the P/E approaches 19 makes sense in the next few years. Currently, we would maintain a maximal overweight toward equities but would minimize U.S. exposure favoring overseas stocks in both emerging and developed stock markets. We also recommend a barbelled sector exposure toward both defensive sectors (e.g., utilities and consumer staples) and some cyclical sectors (e.g., energy, materials and industrials). Should stock markets continue to run to new all-time highs, we will likely get even more defensive. Alternatively, if a correction does come to pass, we expect to take advantage by lifting risk exposures again.

Weekly Trends July 10, 2015 (1)
Written by James W. Paulsen, Ph.D. An investment management industry professional since 1983, Jim is nationally recognized for his views on the economy and frequently appears on several CNBC and Bloomberg Television programs, including regular appearances as a guest host on CNBC. BusinessWeek named him Top Economic Forecaster, and BondWeek twice named him Interest Rate Forecaster of the Year. For more than 30 years, Jim has published his own commentary assessing economic and market trends through his newsletter, Economic and Market Perspective, which was named one of “101 Things Every Investor Should Know” by Money magazine.
Written by James W. Paulsen, Ph.D., Chief Investment Strategist, Wells Capital Management, Inc., a business of Wells Fargo Asset Management Wells Fargo Asset Management (WFAM) is a trade name used by the asset management businesses of Wells Fargo & Company. WFAM includes Affiliated Managers (Galliard Capital Management, Inc.; Golden Capital Management, LLC; Nelson Capital Management; Overland Advisors; Peregrine Capital Management; and The Rock Creek Group); Wells Capital Management, Inc. (Metropolitan West Capital Management, LLC; First International Advisors, LLC; and ECM Asset Management Ltd.); Wells Fargo Funds Distributor, LLC; and Wells Fargo Funds Management, LLC.
Wells Fargo Funds Management, LLC, a wholly owned subsidiary of Wells Fargo & Company, provides investment advisory and administrative services for Wells Fargo Advantage Funds®. Other affiliates of Wells Fargo & Company provide subadvisory and other services for the funds. The funds are distributed by Wells Fargo Funds Distributor, LLC, Member FINRA/SIPC, an affiliate of Wells Fargo & Company. For more information about Wells Fargo Advantage Funds®, call 1-888-877-9275.
Certain investments are distributed in the U.S. by Wells Fargo Funds Distributor, LLC, Member FINRA/SIPC, a subsidiary of Wells Fargo & Company. Wells Fargo Securities International Limited, First International Advisors and ECM Asset Management Limited are authorized and regulated by the U.K. Financial Conduct Authority. First International Advisors and ECM Asset Management are also registered with the Securities and Exchange Commission in the USA.
Wells Capital Management (WellsCap) is a registered investment adviser and a wholly owned subsidiary of Wells Fargo Bank, N.A. WellsCap provides investment management services for a variety of institutions. The views expressed are those of the author at the time of writing and are subject to change. This material has been distributed for educational/informational purposes only, and should not be considered as investment advice or a recommendation for any particular security, strategy or investment product. The material is based upon information we consider reliable, but its accuracy and completeness cannot be guaranteed. Past performance is not a guarantee of future returns. As with any investment vehicle, there is a potential for profit as well as the possibility of loss. For additional information on Wells Capital Management and its advisory services, please view our web site at www.wellscap.com, or refer to our Form ADV Part II, which is available upon request by calling 415.396.8000. WELLS CAPITAL MANAGEMENT® is a registered service mark of Wells Capital Management, Inc.
FOR INSTITUTIONAL INVESTOR USE ONLY – NOT FOR USE WITH THE RETAIL PUBLIC