For this week's SIA Equity Leaders Weekly, we are going to focus our discussion on the rising Bond interest rates in Canada and potential rising interest rates in the US to see how this may effect our outlook on the Bond market and if there is still opportunities in long-term bonds moving forward.
iShares Core Canadian Long-Term Bond (XLB.TO)
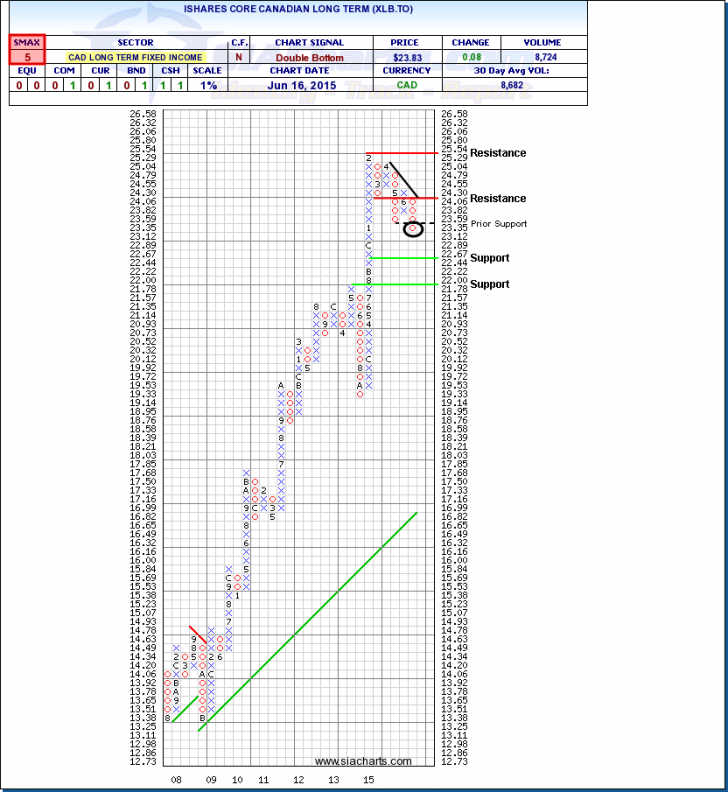
The Government of Canada benchmark long-term bond yield rose from 2.37 per cent on April 30 to 2.63 per cent on May 31. You can see on this chart to the right that this has negatively affected the performance of long-term bonds in Canada. The iShares Core Canadian Long-Term Bond (XLB.TO) has seen a move down through its prior support level and now the next support level is found at $22.44. Should this short-term weakness reverse, the first resistance level is found at $24.30.
After an unprecedented run for long-term bonds with around 14 months in a column of X's from the end of 2013 to February of 2015, the 3 most recent pull-backs have all unsuccessfully been able to recover to its prior levels with each move. A short-term recovery for XLB.TO is definitely possible like in prior months, but with an SMAX score of 5 out of 10, XLB.TO is showing more near-term weakness than before and has moved to a double bottom chart pattern as well. Keeping a close eye on the interest levels and the Government of Canada's policy changes will be important for further understanding on whether this run in long-term bonds will continue or face downward pressure.
SPDR Barclays Long Term Treasury ETF (TLO)
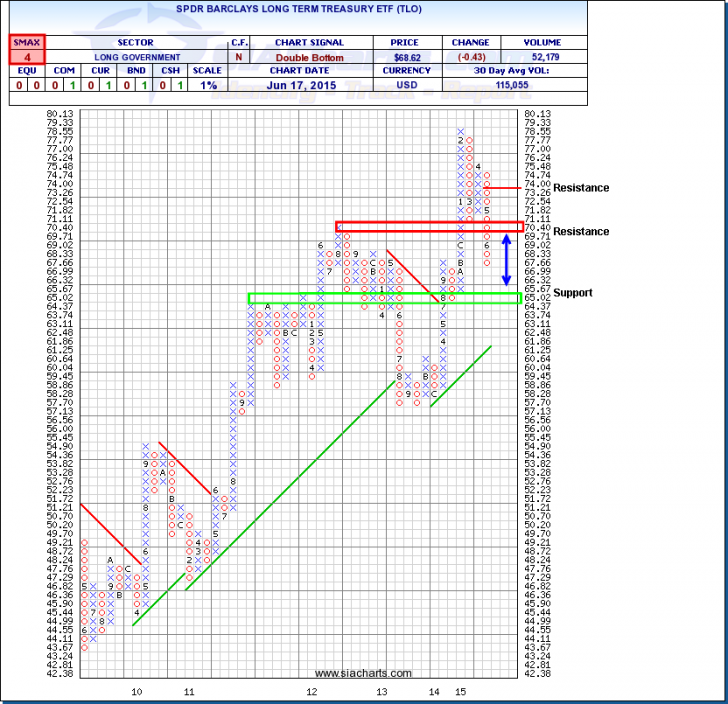
In the U.S., the central bank's latest policy statement keeps it on track for gradual tightening, but left key interest rates unchanged. Fed Chair Janet Yellen, however, emphasized that the rate decision was still up in the air and rested squarely on further improvement in the labor market looking for "more decisive evidence" before making changes. With any interest rate changes, long-term bonds will be the most affected area so taking a look at a long-term Treasury ETF in TLO can give us some insight on the current and potential movement. As you can see in the chart, TLO has weakened after its strong start to 2015 to move below a key support level that was found at $70.40 and now serves as resistance to the upside. Current support is now found in the $64-$65 area which the long-term upwards trend line potentially coming into play after that around $61.25.
TLO has a short-term SMAX score of 4 out of 10 showing weakness across other asset classes. With four more policy-setting meetings this year, the Fed will continue to look to labor market improvement and inflation confidence towards its objective before potentially raising rates towards the end of 2015. Keeping a close eye on those levels may give you some insight on potential Central Bank actions, but using Relative Strength analysis of the Bond markets can give you insight into what the footprints that the market may already be positioning itself towards.
For a more in-depth analysis on the relative strength of the bond markets or for more information on SIACharts.com, you can contact our customer support at 1-877-668-1332 or siateam@siacharts.com.
Click on Image to Enlarge
SIACharts.com specifically represents that it does not give investment advice or advocate the purchase or sale of any security or investment. None of the information contained in this website or document constitutes an offer to sell or the solicitation of an offer to buy any security or other investment or an offer to provide investment services of any kind. Neither SIACharts.com (FundCharts Inc.) nor its third party content providers shall be liable for any errors, inaccuracies or delays in content, or for any actions taken in reliance thereon.


