
by Patrick O'Shaugnessy, The Investor's Field Guide
We know that markets overdo it at extremes. At the market level, we call these bubbles or manias, panics or crashes. At the stock level, we call them glamour and value. Let’s collect some lessons from the best performing stocks from the two categories where investors have the most extreme (good or bad) expectations for the future—value and glamour stocks.A quick definition: glamour stocks are those stocks that are in the most expensive 10% of the market at any given time, value stocks are those in the cheapest 10% (both rebalancing annually). Keep in mind that when I say “expensive” I actually mean “high expectations” and when I say “cheap” I mean “low expectations.” The whole premise of value investing isn’t that value stocks are good companies (more often they stink), only that the expectations are too low (and vice versa for glamour).Starting with these two categories, we then further divide stocks into 10 more groups based on their forward 1-year returns (for this experiment we can forecast the future). I’ve discussed this before, but here are the results.
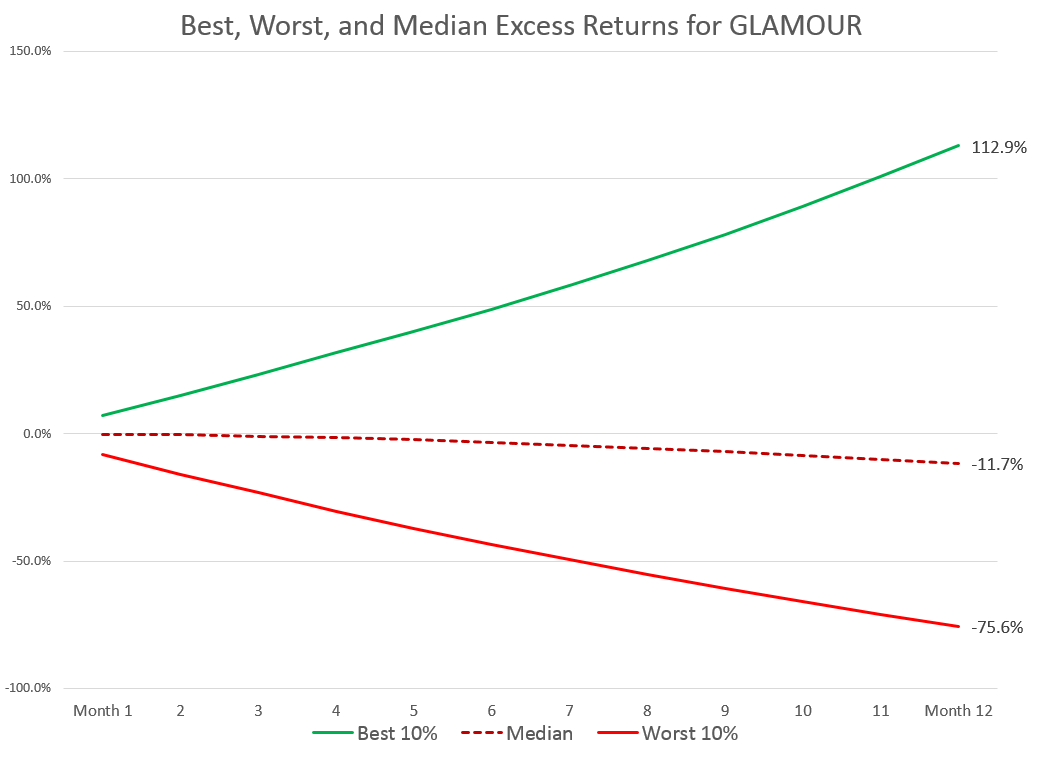
The best performing glamour stocks are incredible: outperforming by 112% on average. But the median result is underperformance of 11%. Great possibilities, bad probabilities.
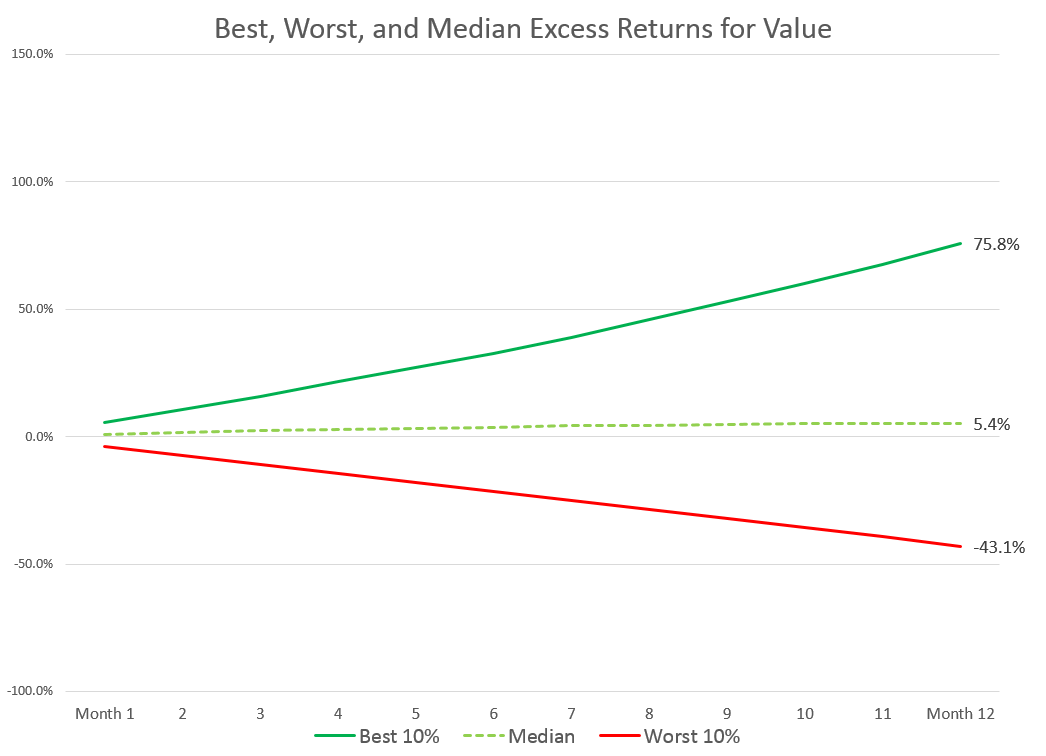
 The best performing value stocks do really well too, but deliver a slightly less exciting 78% average excess return. But the median result is a positive 5%. Great possibilities and great probabilities.
 But now let’s go a level deeper by focusing on just the best performers from each category (the top green line in these graphs). If there are roughly 3,500 tradable stocks in the U.S. today, this means we are narrowing our gaze to 35 stocks on either end of the spectrum, 1% of the market each from value and glamour. We check in on these 35 or so names (there are fewer back in history) every year back to the early 1960’s.
The key lesson we learn is that the excess returns of the best value stocks are far more consistent, if not as impressive. The standard deviation of the return for value’s best performers is 45% historically. For glamour, it is 107%! Here is a distribution of the excess returns.
Consistent with the first few charts, glamour has a much longer tail: more instances of incredible excess returns.
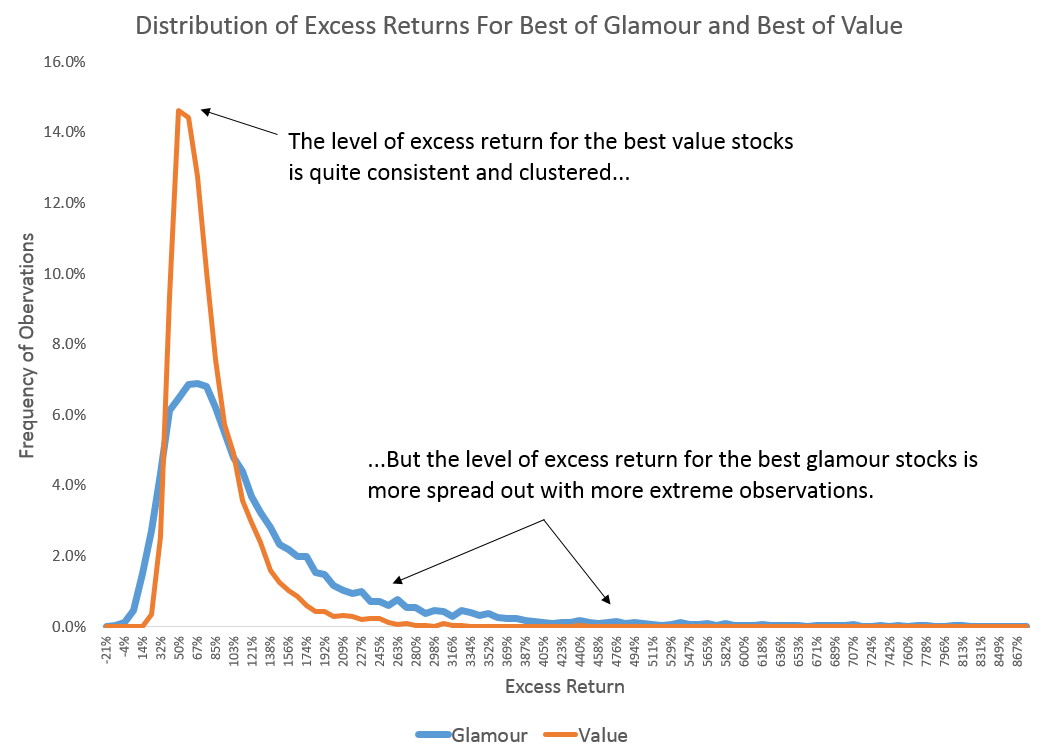 Most of the best value stocks—82% of the total observations—delivered an excess return up to 100%, leaving 18% with higher than 100%.For glamour, almost half (46%) delivered excess returns higher than 100%.
Further, of the best performing glamour stocks, roughly 25% of them delivered an excess return of 150% or higher in a one year period. Only 6% of the best performing value stocks did the same. The best performing glamour stocks are the ultimate winning lottery tickets.
No wonder growth investing is so damn enticing! Now if only we could figure out a way to consistently identify these high-flying glamour stocks (spoiler: you can’t).
These results confirm that value is less exciting than glamour in every way—except for their long term median results. The stories are better for glamour, the futures for the companies appear brighter, and the best performers end up delivering more impressive returns. Yet through it all, value stocks—with their lame outlooks, boring stories, and more homogenous returns—are the ones which, as a category, have delivered the best results to investors.
Bottom line: value wins again for consistency the fact that the median value stock has outperformed nicely. Glamour has the more fun and exciting outliers, but the median glamour stock gets killed and even the best ones are extremely volatile.
Note: I removed anything with a 12-month return of 1,000% or higher to control for extreme outliers. Eligible stocks must have a market cap > $200MM (inflation adjusted) and be a U.S. company.
Copyright © The Investor's Field Guide