Accounting for, Valuing, and Pricing Cash
- Expected net income from software = $72 million
- Expected reinvestment to generate growth = 2%/36% = 5.56%
- Value of Software business = 72 (1-.0556)/ (.10-.02) = $850 million
- Expected pre-tax income from cash = $ 200 (.02) = $4 million
- Cost of equity = Riskfree rate = 2%
- Value of equity = 4/.02 = $200 million
In pricing, the tool used in comparisons is usually a multiple and the most commonly used multiple is the PE ratio. To set the table for that discussion, I have restated the intrinsic value balance sheet in the form of PE ratios for the software business, cash and equity overall.
The PE ratios for software and cash are computed by dividing the intrinsic values of each one by the after income generated by each. The PE ratio for cash can be simplified and stated as a function of the risk free rate and tax rate:
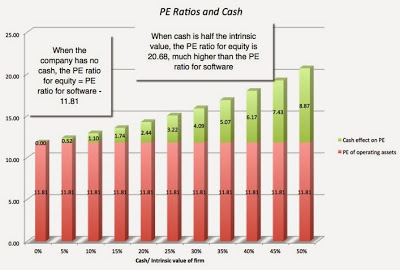
The PE ratio for cash is much higher than the PE for software (11.81) and it is pushing up the PE ratio for equity in the company to 14.11. Put differently, if the stock is priced based on its intrinsic value, it should trade at a PE ratio of 14.11.
How will bringing in debt into this process change the game? Let's assume that you borrowed $300 million and bought back stock in this company, while leaving the existing cash balance unchanged. Reducing your market cap by roughly $300 million will augment the effect of cash on PE and make the non-cash PE ratio even lower.
Cash Balances and PE: Determinants
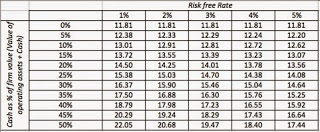
Thus, a cash balance that amounts to 20% of firm value will push PE ratios from 15.38, when the short-term, risk free rate is 1% and to only 14.08, when it is 5%.
The US Market: PE and Cash
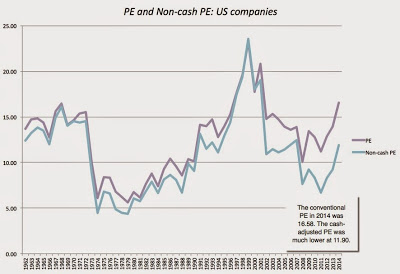
At this point in this discourse, you may be wondering why we should care, since companies in the US have always held cash and had to earn close to a short-term risk free rate on that cash. That is true but we live in uncommon times, where risk free rates have dropped and corporate cash holdings are high, as is evidenced in this graph that looks at cash as a percent of firm value (market value of equity+ total debt) for US companies, in the aggregate, from 1962 to 2015 and the one-year treasury bill rate (as a proxy for short term, risk free rates):
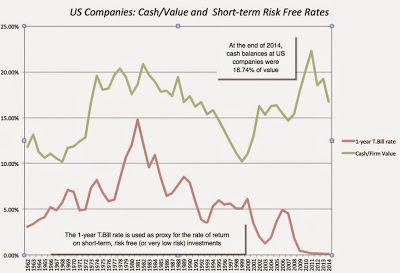 |
| Data from Compustat & FRED: Computed across all money-making companies |
Sector Differences in Cash and PE
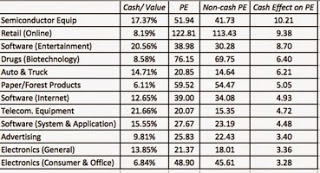
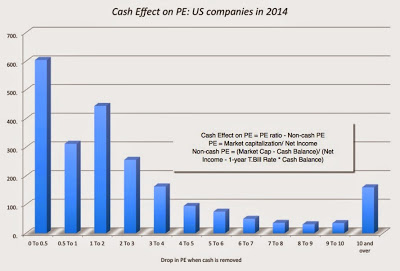
In the second part of the analysis, I computed the cash effect on PE for individual companies and then looked at the distribution of this cash effect across all companies:
It delivers the message that there is no simple rule of thumb that will work across all companies or even across companies within a sector.
Perhaps, the best way to check out the effect of cash on PE is to pick a company and take it through the cleansing process, a very simple one that requires relatively few inputs. Use this spreadsheet to try it on your favorite (or not-so-favorite) company.
Rules for dealing with cash
Spreadsheets
- Intrinsic value of cash and operating assets (to back up example in post)
- PE Cleanser (to compute non-cash PE for a company)
Datasets
Copyright © Musings on Markets


