


by Wesley Gray, Alpha Architect
A lot of investors ask this question as their wealth grows and the number of financial products grows exponentially. In order to generate a response, investors pay money to professional finance geeks who often present complex formulas as a solution to the asset allocation problem. Last year, when I was asked to present a seminar on the subject at the Morningstar ETF conference, I developed a tongue-in-cheek title for it: “Beware of Geeks Bearing Formulas.”
In this short research piece we explore this seminar in detail. Our goal as evidence-based investors, and not story-based investors, is to set the record straight on the value of complexity in the context of asset allocation.
Bottom line: simple seems to be better.
Defining Tactical Asset Allocation (TAA)
What exactly is tactical asset allocation? I like to work backward to forward, since it helps to build the concept.
- Allocation (A): Our baseline, or static allocation to assets in our universe.
- E.g., 50% stocks, 50% bonds, rebalanced annually.
- Asset (A): Financial assets that can be traded with reasonable liquidity. A key component of being “tactical” is being liquid, which implies that hedge funds, private equity, and other asset classes with limited liquidity rights should be avoided in the context of “tactical” asset allocation.
- E.g. Stocks, bonds, commodities, alternatives (if liquid).
- Tactical (T): Changing our baseline allocation based on some tactical rules.
- E.g., 50% stocks, 50% bonds –> 30% stocks, 70% bonds based on a market valuation signal.
So there you have it, tactical asset allocation is tactically investing in liquid assets in order to beat a static benchmark allocation.
Basic Asset Classes:
There is an old investor adage that you shouldn’t put all of your eggs in one basket. For my classes, I dive into correlation mathematics to prove this point (see below), but the conceptual benefit of diversification is grounded in common sense.

But how do we identify the eggs that go into our diversification basket?
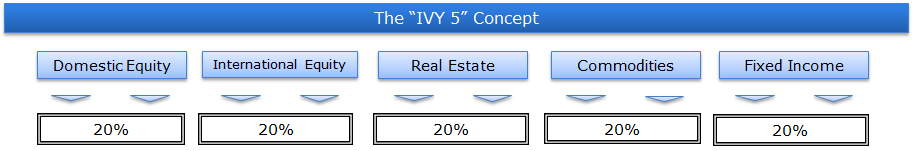
Meb Faber highlights in his Ivy Portfolio book, and reemphasizes in his new book Global Asset Allocation, that you don’t need to get fancy when it comes to asset class selection. One can capture the big muscle movements of the world by simply allocating across 5 asset classes:
- Domestic Equity = SP500 Total Return Index
- International Equity = MSCI EAFE Total Return Index
- Real Estate = FTSE NAREIT All Equity REITS Total Return Index
- Commodities= GSCI Index
- Fixed Income = Merrill Lynch 7-10 year Government Bond Index
We label the return series as follows throughout the analysis:
- SP500 = SP500 Total Return Index
- EAFE = MSCI EAFE Total Return Index
- REIT = FTSE NAREIT All Equity REITS Total Return Index
- GSCI = GSCI Index
- LTR = Merrill Lynch 7-10 year Government Bond Index
Common Asset Allocation Techniques
We discuss five common asset allocation techniques that are commonly utilized in one form or the other by academics and/or practitioners.
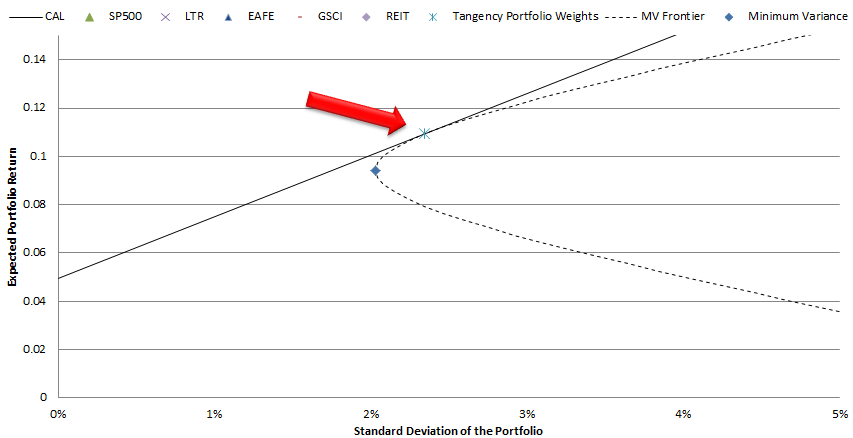
1. Tangency Portfolio/ Max Sharpe Portfolio
Modern portfolio theory, inspired by Markowitz‘s work on mean-variance-analysis in the early 1950’s, identified the optimal trade-off between risk and reward for a portfolio. Of course, the underlying assumptions serving as the foundation for this so-called “optimal” algorithm stretch the imagination, but the intellectual construct and concepts are rock solid.
The punchline from modern portfolio theory is the so-called “tangency portfolio.” This portfolio is identified by the “x” with a vertical line through it and sits on the CAL (capital allocation line). For those of you who haven’t taken an investment management course in a while, the CAL represents all combinations of risk-free rate and the tangency portfolio. These are “optimal” portfolios because there is no possible way to achieve a higher risk/reward. The optimal allocation weights for a 100% risk investor (i.e., no allocation to risk-free bonds) are the tangency portfolio weights.
2. Minimum Variance Portfolio
Many readers are probably familiar with minimum variance portfolios. As the name implies, minimum variance portfolio weights are identified such that the portfolio’s expected variance is minimized. We can’t get too excited over the minimum variance portfolio–being low variance doesn’t necessarily mean something is a good investment. We need to consider expected return. In a modern portfolio theory context, the minimum variance portfolio (represented by the diamond below) is actually sub-optimal and should never be used. Instead, an investor can simply hold a small portion in risk-free bonds and the tangency portfolio to achieve a result with the same risk, but higher return.
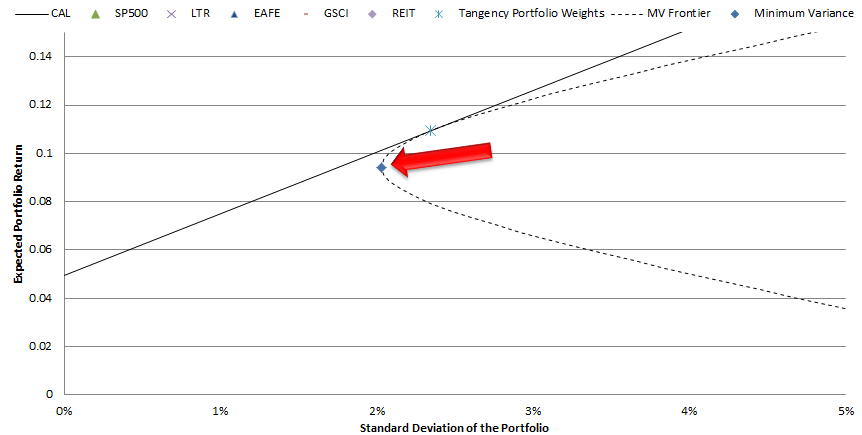
Interestingly, even though there is no theoretical basis for its use, the minimum variance algorithm is often used in practice…
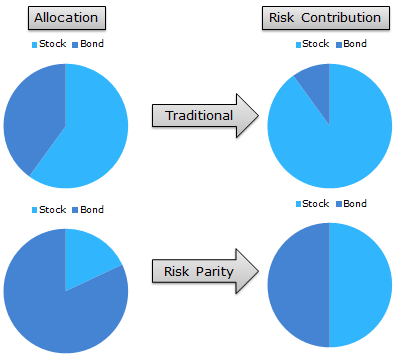
3. Risk Parity Portfolio
Risk parity has been widely advocated recently, partly due to the success of the strategy’s largest proponent–Bridgewater Associates, LP. The basic concept behind risk parity is to equalize risk allocations across asset classes. For example, consider a traditional 60/40 stock/bond portfolio allocation. The “problem” with this allocation is that a large portion of the portfolio’s risk is driven by the stock allocation. Let’s say 90 percent of the risk is driven by the 60 percent allocation to stocks, and only 10 percent of portfolio’s risk is driven by the 40 percent allocation to bonds. Risk parity argues that we should allocate to stocks and bonds such that 50 percent of the portfolio’s risk is driven by the stock allocation and 50 percent is driven by the bond allocation. For example purposes, let’s say that a 50/50 risk contribution implies a 80 percent allocation to bonds and a 20 percent allocation to stocks.
The figures below attempt to explain this via illustrations. Also, here’s a post that explains risk parity logistics.
4. Momentum Portfolio
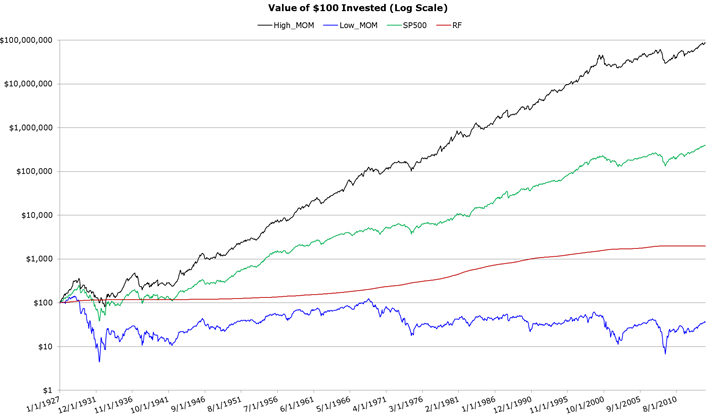
Momentum strategies overweight assets that have relative strength over the mid-term (e.g., 1-year) and underweight assets that have performed relatively poorly over the mid-term. This basic concept has been applied across asset classes, asset sectors, and on individual securities. As an example, the chart below shows the invested growth of high momentum portfolios and low momentum portfolios back to 1927. The data is from the French library. The historical performance of momentum strategies speaks for itself. In an asset allocation context, a momentum strategy will allocate more to relatively strong performing assets and relatively less to poor performing assets.
5. Simple Trend-Following Portfolios
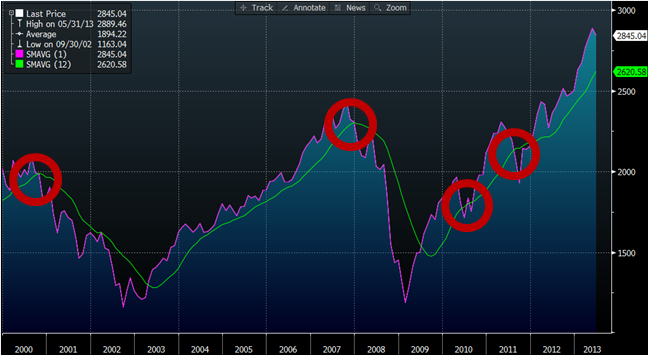
Simple moving averages represent a classic trend following strategy. The rule is simple: If the market is above the 200-day moving average rule, hold, otherwise go to cash. Wharton Professor Jeremy Siegel found that this simple technical rule outperforms a buy-and-hold approach, both in absolute terms and on a risk-adjusted basis. In general, while efforts to time the market should be viewed with skepticism, certain systematic timing strategies that have been explored in academia appear to reduce risk, without significantly impacting long-run returns. In particular, the application of simple moving average rules has been demonstrated to protect investors from large market drawdowns, which is defined as the peak-to-trough decline experienced by an investor. Siegel, in his book, “Stocks for the Long Run,” explores the effect on performance on the Dow Jones Industrial Average from 1886 to 2006, when applying a 200-day moving average rule.
Performance of Common Techniques
Let’s run a horse-race on the various asset allocation strategies described above. The back test period is from 1/1979 to 12/2013.
Our core 5 assets are:
- SP500 = SP500 Total Return Index
- EAFE = MSCI EAFE Total Return Index
- REIT = FTSE NAREIT All Equity REITS Total Return Index
- GSCI = GSCI Index
- LTR = Merrill Lynch 7-10 year Government Bond Index (prior to 6/1982, Amit Goyal Data)
Our back test asset allocation strategies are:
- RISK_PARITY = Risk parity on core 5 asset classes, 3-yr rolling windows
- MOM_TAA = Relative momentum on core 5 asset classes, calculated using 12-month momentum
- MAX_SHARPE = Tangency portfolio weights on core 5 asset classes, 3-yr rolling windows (weights constrained [-1,1])
- MIN_VAR = Minimum variance portfolio weights on core 5 asset classes, 3-yr rolling windows
- EW_INDEX = Equal-weight, monthly rebalanced across core 5 asset classes
- EW_INDEX_MA = Equal-weight, monthly rebalanced across core 5 asset classes, with 12-month moving average rule
- RANDOM = ¼ random chance of moving to risk-free rate, monthly rebalanced across core 5 asset classes
Results are gross of management fee and transaction costs and for illustrative purposes only. These are simulated performance results and do not reflect the returns an investor would actually achieve. All returns are total returns and include the reinvestment of distributions (e.g., dividends). Max Sharpe weights are constrained between -1 and 1. Data is from Bloomberg and publicly available sources.
Summary Statistics: Benchmarks
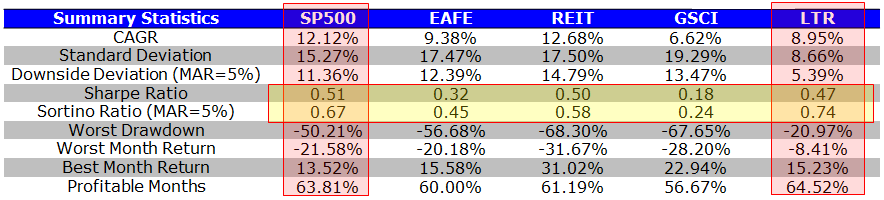
Over the time period, the S&P 500 and 10-Year bond exposures perform the best. It is no wonder that a 60/40 portfolio is so popular these days–the strategy cherry picks the best performing assets over the past 30+ years.
Summary Statistics: Asset Allocation with Core 5
The EW_INDEX strategy and the RANDOM strategies serve as benchmarks for the tactical asset allocation models (their construction is outlined above).
The results can be summarized as follows:
- The tangency portfolio, or “max-sharpe” method perform the worst and cannot even compete with the benchmarks.
- Minimum variance beats the tangency portfolio, which is ironic, given the theoretical underpinnings for the tangency portfolio. Nonetheless, the strategy, while risk-managed, does poorly on upside returns, underperforming the simply 10-Year bond CAGR.
- The risk parity methodology performs admirably, with strong risk-adjusted statistics and strong drawdown containment.
- Momentum also performs admirably, with the highest CAGR, however, the strategy has to contend with large drawdowns.
- The EW index with trend-following performs the best, capturing much of the upside, but preventing large drawdowns.
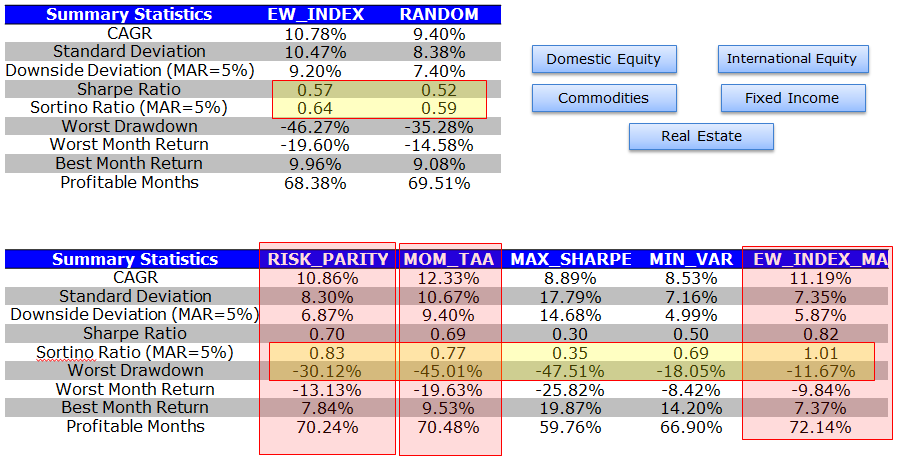
Overall, risk parity, momentum and EW w/ MA look like the top performers.
Summary Statistics: Asset Allocation with Core 4
As a robustness test, we run all our tests for all tactical asset allocation models with and without 10-Year Treasury Bond exposure. We do these tests because the 10-Year has been on an epic tear over the past 30 years, which makes it challenging to ascertain whether a tactical strategy is lucky or good when a system chooses a large position in Treasury Bonds. If a tactical system is robust it should work on 2 assets, 4 assets, 5 assets, or 50 assets.
Again, similar to the last table, we present the summary statistics for the EW_INDEX and RANDOM, which serve as benchmark performance guidelines when fixed-income is not included as an asset class.
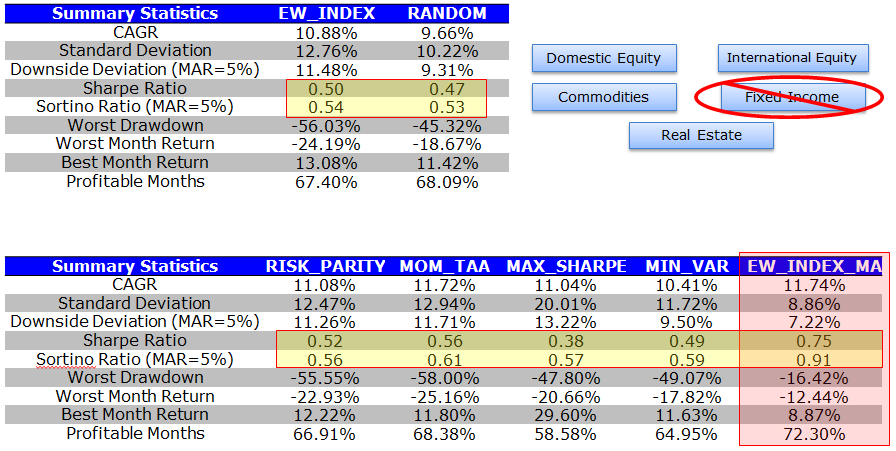
The results can be summarized as follows:
- Risk parity completely blows up and no longer works. Clearly, the results associated with risk parity are dependent on 10-Year Treasury exposure.
- Minimum variance and tangency portfolios do not beat the benchmarks.
- Momentum squeaks out a small gain on a risk-adjusted basis relative to the benchmarks, but the edge is much lower.
- The EW index with trend-following performs the best, capturing much of the upside, but preventing large drawdowns.
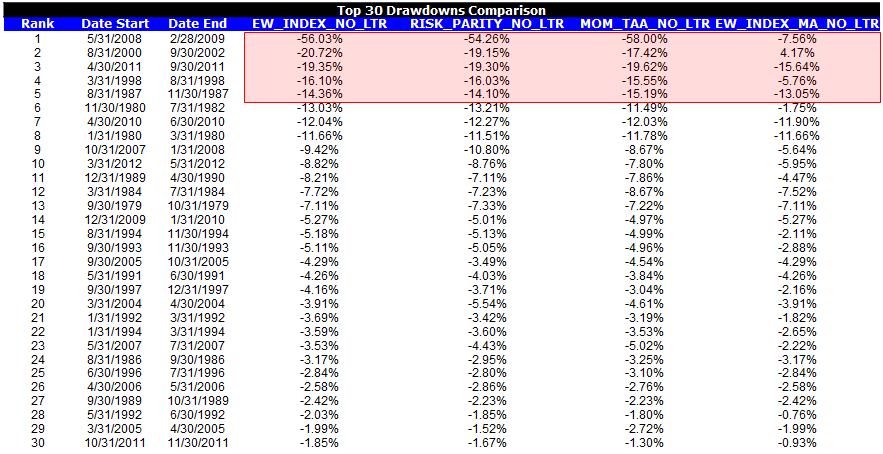
We highlight the drawdowns associated with the top-performing asset allocation systems, but exclude 10-years an an allocation choice. The only system that provides robust drawdown protection is the trend-following system.
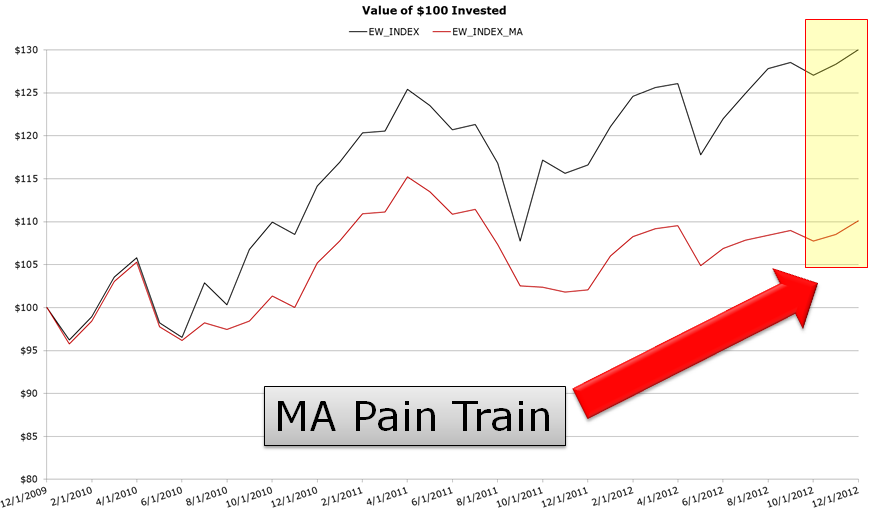
So Trend-Following looks to be the winner–Time To Go All-In?
Based on the results over the past 30+ years, trend-following looks to be the most effective and the most robust form of tactical asset allocation…
But how has the trend-following system performed since the 2008 financial crisis? Well, in a word, terribly.
The chart below highlights the performance path of the EW buy & hold strategy versus the EW w/ trend-following index.
Conclusion
There is no panacea when it comes to tactical asset allocation. The evidence seems to suggest that trend-following rules are the most effective and the most robust, but as the recent 5 year run highlights, NOTHING WORKS ALL THE TIME.
Copyright © Alpha Architect