by Don Vialoux, EquityClock.com
Pre-opening Comments for Monday June 1st 2015
U.S. equity index futures were higher this morning. S&P 500 futures were up 5 points in pre-opening trade.
Index futures moved slightly lower following release of economic news at 8:30 AM EDT. Consensus for April Personal Income was an increase of 0.3% versus no change in March. Actual was an increase of 0.4%. Consensus for April Personal Spending was an increase of 0.2% versus a gain of 0.4% in March. Actual was unchanged.
Intel has offered to acquire Altera for $54 per share cash. Value of the offer is $16.7 billion. Altera gained $2.35 to $51.20. Intel improved $0.22 to $34.68
Enbridge (ENB $47.92) is expected to open higher after Credit Suisse upgraded the stock to Outperform.
Coca Cola added $0.27 to $41.23 after BMO Capital upgraded the stock to Outperform.
Express Scripts slipped $0.35 to $86.79 after Raymond James downgraded the stock to Market Perform.
Citigroup added $0.61 to $54.69 following an upgrade by Goldman Sachs
EquityClock’s Daily Market Comment
Following is a link:
http://www.equityclock.com/2015/05/31/stock-market-outlook-for-june-1-2015/
Note the seasonality study comparing performance of the S&P 100 relative to the S&P 500.
Interesting Study on the Performance by the S&P 500 in June
Following is a link:
http://www.marketwatch.com/story/june-gloom-looms-for-the-stock-market-2015-05-29
The study shows that June has been the weakest month for the S&P 500 Index during the past 10 years. The study also show performance by sector.
Economic News This Week
April Personal Income to be released at 8:30 AM EDT on Monday is expected to increase 0.3% versus no change in May. April Personal Spending is expected to increase 0.2% versus a gain of 0.4% in March
May ISM to be released at 10:00 AM EDT on Monday is expected to increase to 51.9 from 51.5 in April
April Construction Spending to be released at 10:00 AM EDT on Monday is expected to increase 0.8% versus a drop of 0.6% in March.
April Factory Orders to be released at 10:00 AM EDT on Tuesday are expected to be unchanged versus a gain of 2.1% in March.
May ADP Private Employment Report to be released at 8:15 AM EDT on Wednesday is expected to increase to 200,000 from 169,000 in April
April Trade Deficit to be released at 8:30 AM EDT on Wednesday is expected to drop to $44.0 billion from $51.4 billion in March
Canadian April Merchandise Trade Balance to be released at 8:30 AM EDT on Wednesday is expected to improve to a deficit of $2.0 billion from a deficit of 3.0 billion in March
May ISM Services to be released at 10:00 AM EDT on Wednesday is expected to slip to 57.1 from 57.8 in April.
Federal Reserve Beige Book is scheduled to be released at 2:00 PM EDT on Wednesday
Weekly Initial Jobless Claims to be released at 8:30 AM EDT on Thursday are expected to dip to 280,000 from 282,000 last week.
Revised First Quarter Productivity to be released at 8:30 AM EDT on Thursday is expected to decline to 2.9% from a first estimate of a decline of 1.9%.
May Non-farm Payrolls to be released at 8:30 AM EDT on Friday are expected to increase to 225,000 from 223,000 in April. May Private Non-farm Payrolls are expected to increase to 225,000 from 213,000 in April. The May Unemployment Rate is expected to remain unchanged from April at 5.4%. May Hourly Earnings are expected to increase 0.2% versus a gain of 0.1% in April.
Earnings News This Week
The Bottom Line
Evidence of waning momentum in world equity markets continues to build. Short and intermediate technical indicators have rolled over from overbought levels. The historic strength in North American equity markets during week of the Memorial Day holiday failed to appear this year. Volatility (i.e. VIX) recorded a mild spike, typical of the start of a summer correction. It’s time to reduce equity exposure.
Mr. Vialoux on BNN Television on Friday
Following is a link:
http://www.bnn.ca/Video/player.aspx?vid=618366
Equity Indices
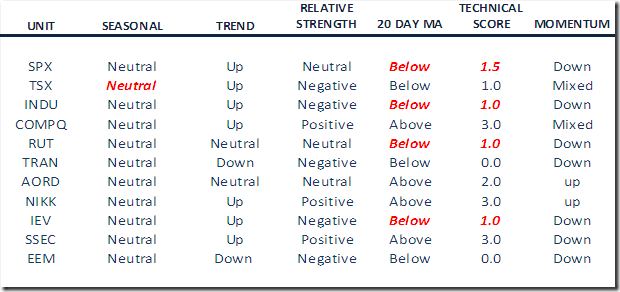
Daily Seasonal/Technical Equity Trends for May 29th
Green: Increase from previous day
Red: Decrease from previous day
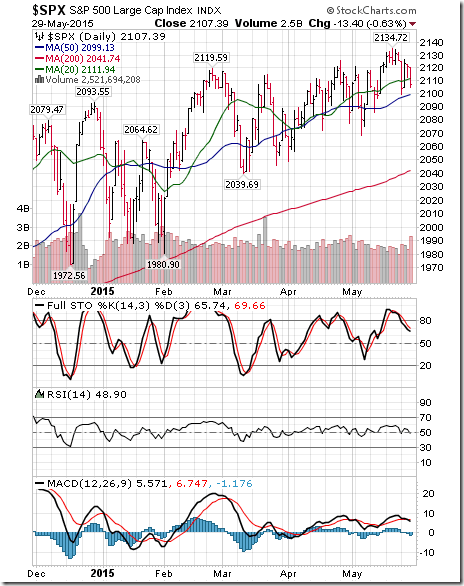
The S&P 500 Index fell 18.67 points (0.88%) last week. The Index is now below its mid-February close. Intermediate trend remains up. The Index fell below its 20 day moving average on Friday. Short term momentum indicators are trending down….
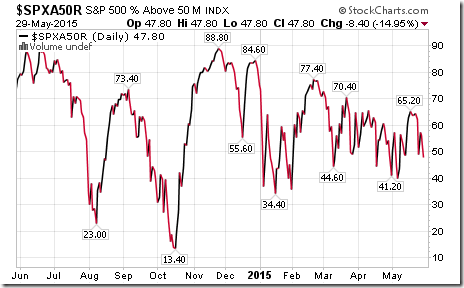
Percent of S&P 500 stocks trading above their 50 day moving average fell last week to 47.80% from 62.40%. Percent is trending down.
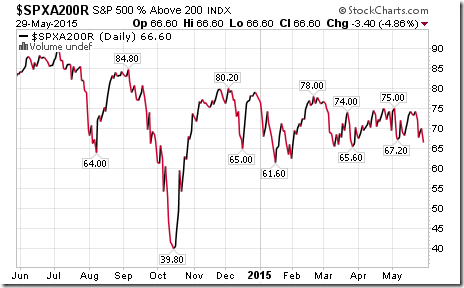
Percent of S&P 500 stocks trading above their 200 day moving average slipped last week to 66.60% from 72.20%. Percent remains intermediate overbought and trending down.
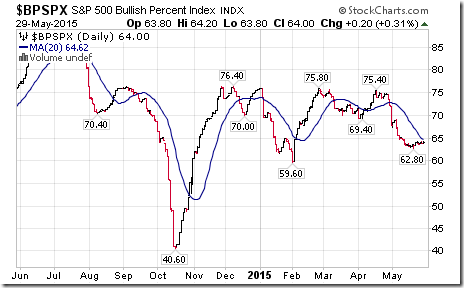
Bullish Percent Index for S&P 500 was unchanged last week at 64.00% and remained below its 20 day moving average. The Index remains intermediate overbought and trending down.
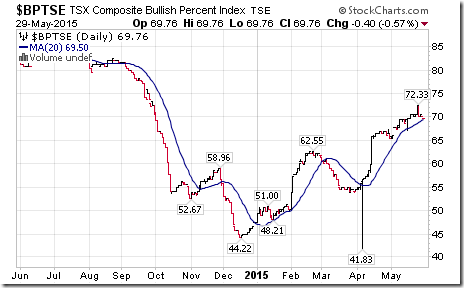
Bullish Percent Index for TSX Composite stocks slipped last week to 69.76% from 70.56% and remained above its 20 day moving average. The Index remains intermediate overbought.
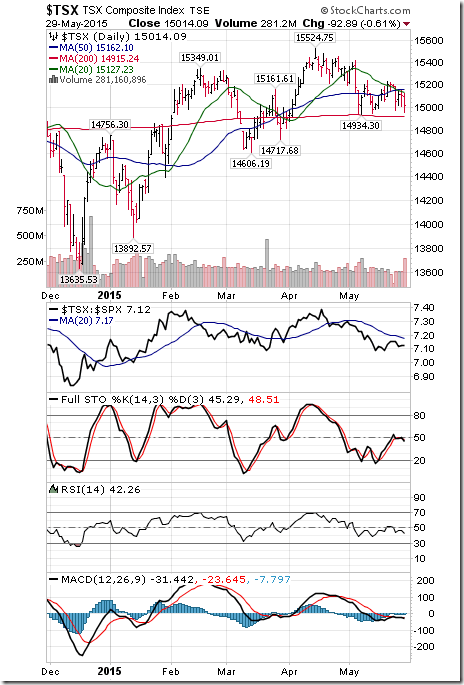
The TSX Composite Index dropped 186.67 points (1.23%) last week. Intermediate trend remains up (Score: 1.0). Note that trend changes to down on a move below 14,934.30. The Index moved below its 20 day moving average (Score: 0.0). Strength relative to the S&P 500 Index remains negative (Score: 0.0). Technical score remains at 1.0 out of 3.0. Short term momentum indicators are mixed.
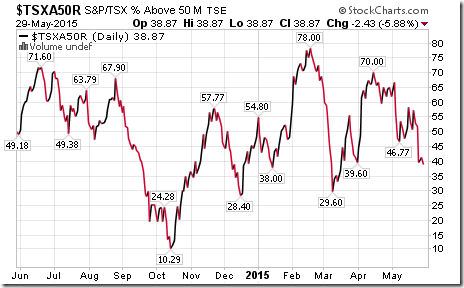
Percent of TSX stocks trading above their 50 day moving average dropped to 38.87% from 52.63% last week. Intermediate trend is down.
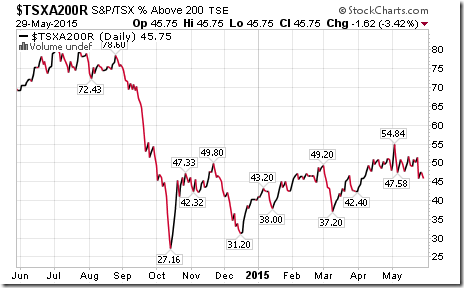
Percent of TSX stocks trading above their 200 day moving average slipped to 45.75% from 50.20%. Percent is trending down.
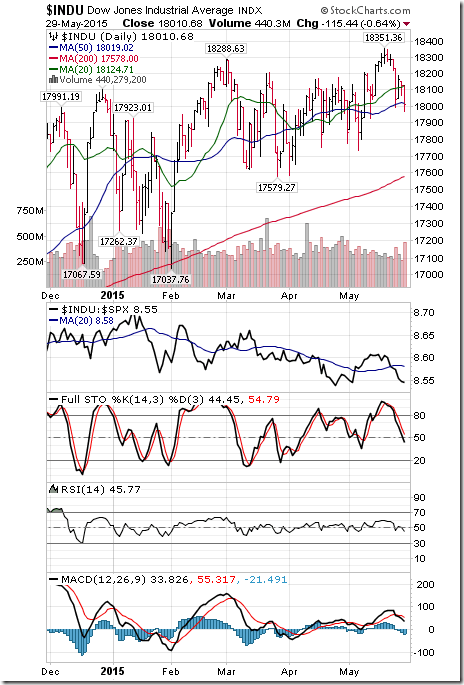
The Dow Jones Industrial Average dropped 221.34 points (1.21%) last week. Intermediate trend remains up. The Average fell below their 20 day moving average. Strength relative to the S&P 500 Index changed to negative from neutral. Technical score dropped to 1.0 from 2.5 out of 3.0. Short term momentum indicators are trending down.
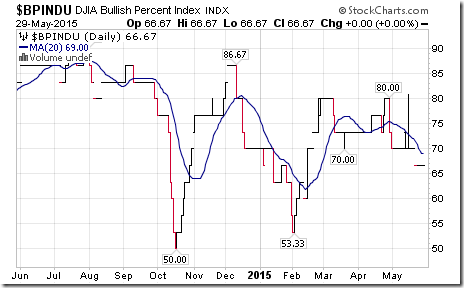
Bullish Percent Index for Dow Jones Industrial Average stocks remained unchanged last week at 66.67% and remained below its 20 day moving average. The Index remains intermediate overbought and trending down.
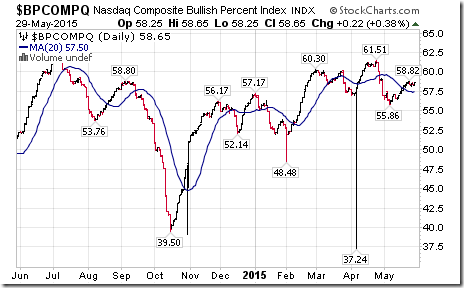
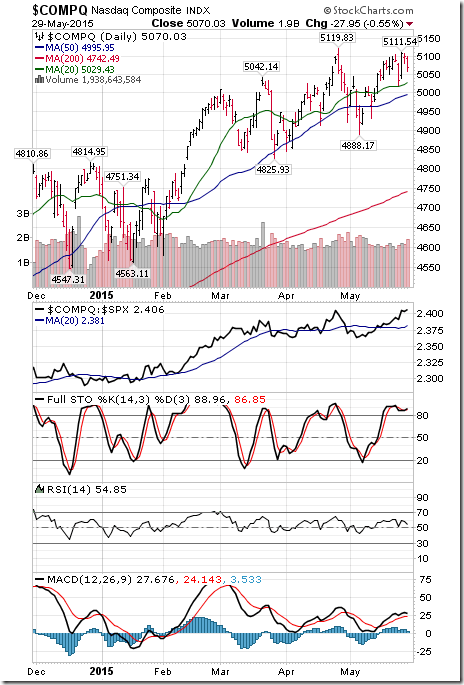
Bullish Percent Index for NASDAQ Composite Index slipped last week to 58.65% from 58.82%, but remained above its 20 day moving average. The Index remains intermediate overbought.
The NASDAQ Composite Index fell 19.33 points (0.38%) last week. Intermediate trend remains up. The Index remains above its 20 day moving average. Strength relative to the S&P 500 Index remains positive. Technical score remained at 3.0 out of 3.0. Short term momentum indicators are mixed.
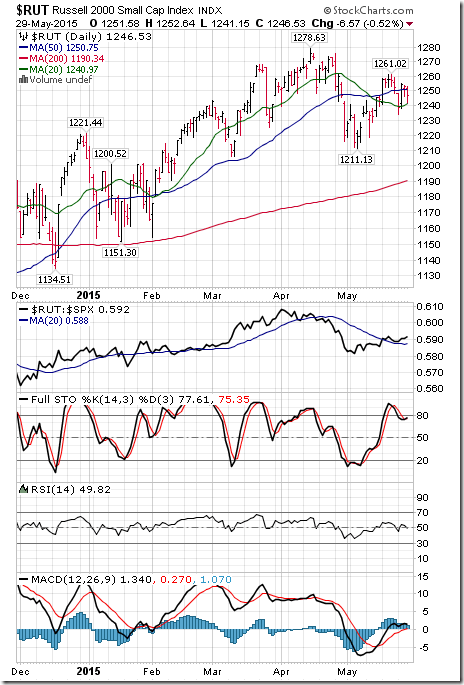
The Russell 2000 Index eased 5.69 points (0.44%) last week. Intermediate trend remains neutral. The Index fell below its 20 day moving average. Strength relative to the S&P 500 Index remains neutral. Technical score dropped to 1.0 from 2.0 out of 3.0. Short term momentum indicators are trending down.
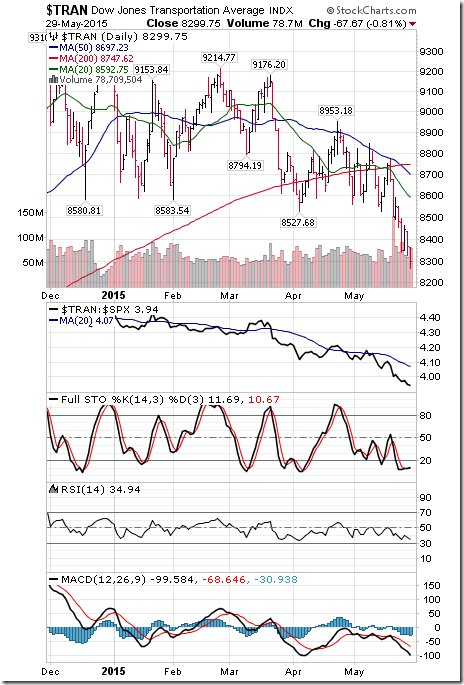
The Dow Jones Transportation Average dropped 182.56 points (2.15%) last week. Intermediate trend remains down. The Average remains below its 20 day moving average. Strength relative to the S&P 500 Index remains negative. Technical score remains at 0.0 out of 3.0. Short term momentum indicators are trending down.
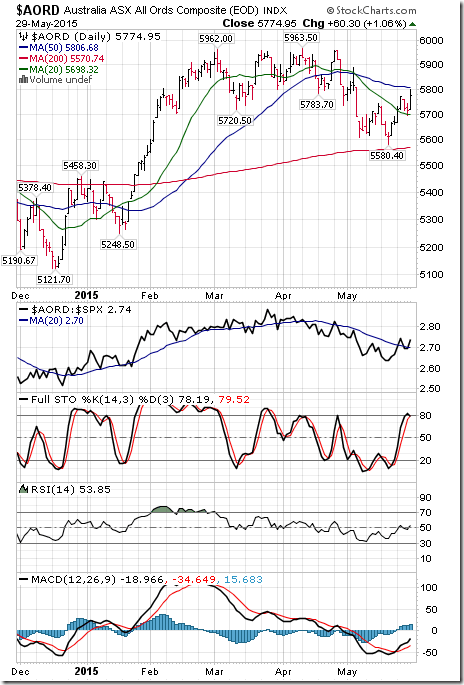
The Australia All Ordinaries added 106.75 points (1.88%) last week. Intermediate trend remains neutral. The Index moved above its 20 day moving average. Strength relative to the S&P 500 Index remains neutral. Technical score improved to 2.0 from 0.5 out of 3.0. Short term momentum indicators are trending up.
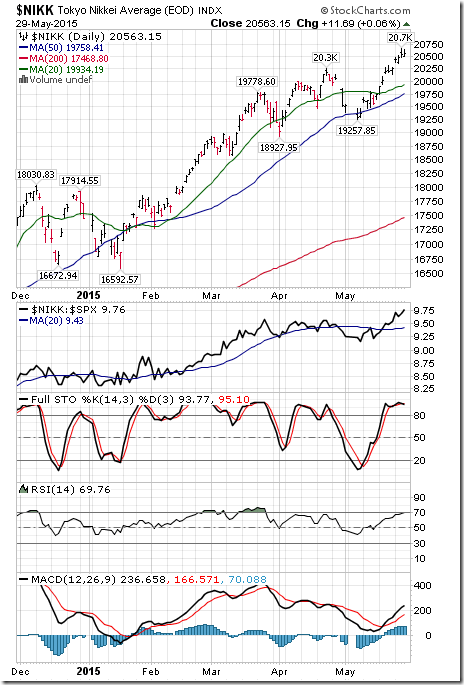
The Nikkei Average added 298.74 points (1.47%) last week. Intermediate trend remains up. The Average remains above its 20 day moving average. Strength relative to the S&P 500 Index remains positive. Technical score remained at 3.0 out of 3.0. Short term momentum indicators are trending up.
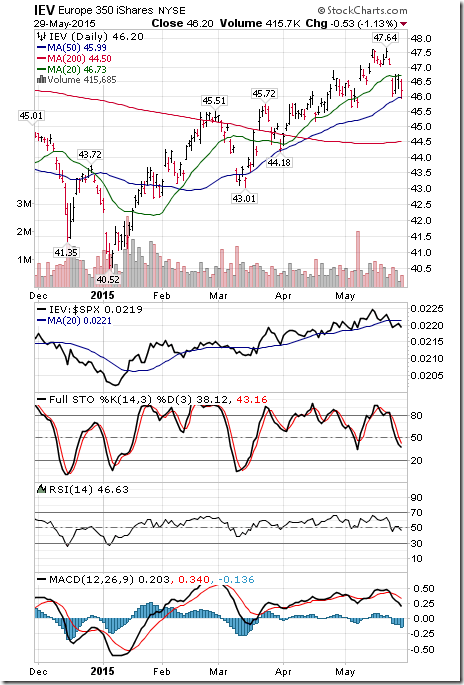
iShares Europe 350 shares dropped $0.89 last week (1.89%) last week. Intermediate trend remains up. Units fell below their 20 day moving average. Strength relative to the S&P 500 Index changed to negative from positive. Technical score dropped to 1.0 from 3.0 out of 3.0. Short term momentum indicators are trending down.
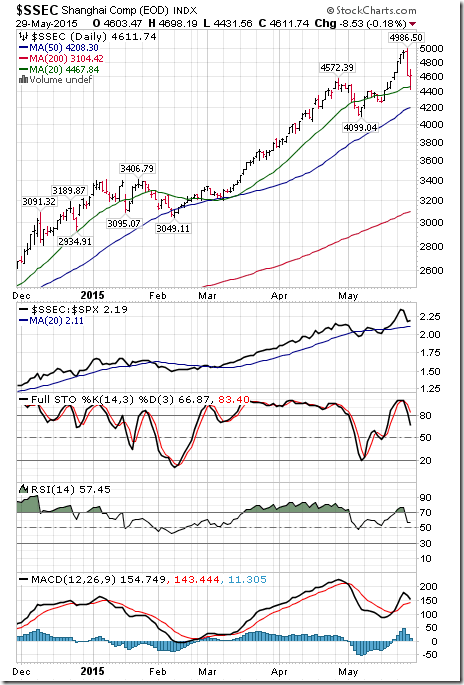
The Shanghai Composite Index dropped 348.91 points (8.10%) last week. Intermediate trend remains up. The Index remains above its 20 day moving average. Strength relative to the S&P 500 Index remains positive. Technical score remains at 3.0 out of 3.0. Short term momentum indicators are trending down.
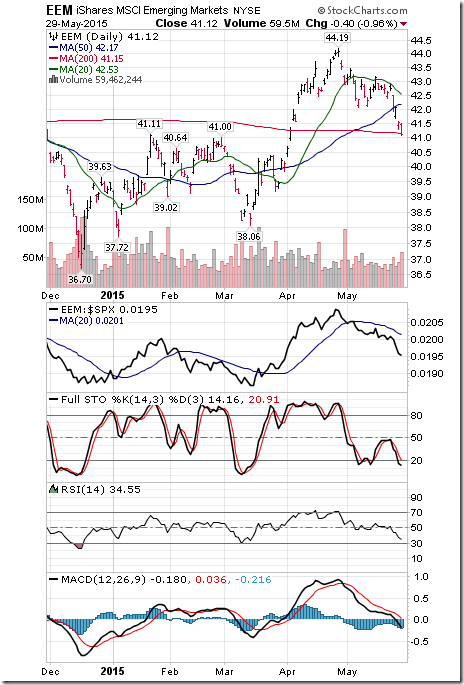
iShares Emerging Markets fell another $0.41 (0.95%) last week. Intermediate trend changed to down from up. Units remain below their 20 day moving average. Strength relative to the S&P 500 Index remains negative. Technical score dropped to 0.0 from 1.0 out of 3.0. Short term momentum indicators are trending down.
Currencies
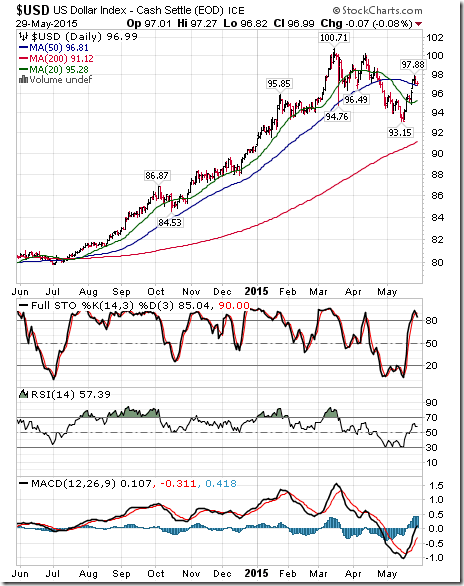
The U.S. Dollar Index added 2.97 (3.18%) last week. Intermediate trend remains down. The Index remained above its 20 day moving average. Short term momentum indicators are trending up.
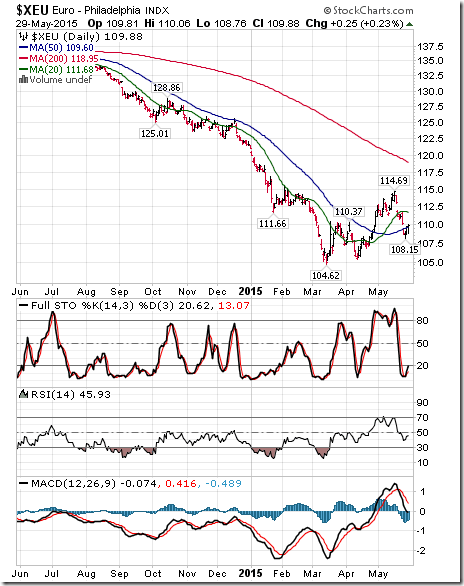
The Euro fell 4.27 (3.73%) last week. Intermediate trend remains up. The Euro remains below its 20 day moving average. Short term momentum indicators are trending down.
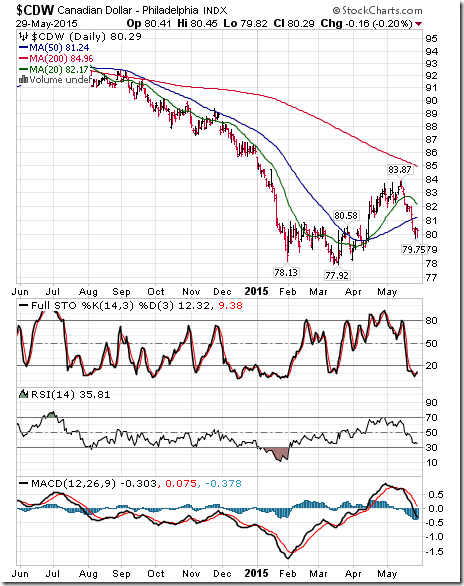
The Canadian Dollar dropped US 1.79 cents (2.15%) last week. Intermediate trend remains neutral. The Canuck Buck remains below its 20 day moving average. Short term momentum indicators are trending down.
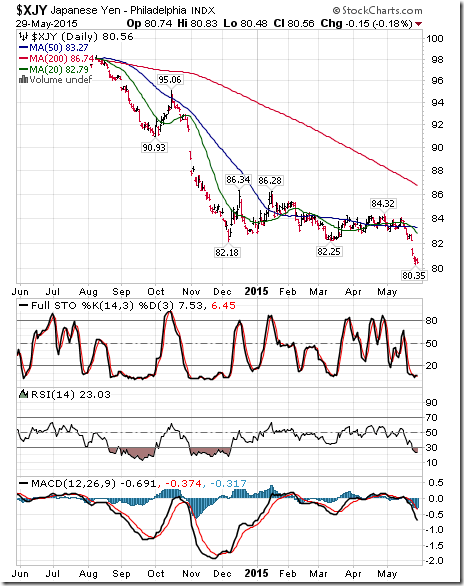
The Japanese Yen fell 1.50 (1.79%) last week. Intermediate trend remains down. The Yen remains below its 20 day moving average. Short term momentum indicators are trending down.
Commodities
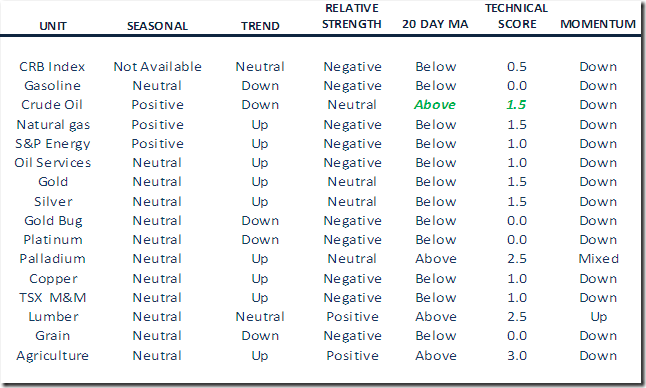
Daily Seasonal/Technical Commodities Trends for May 29th
Green: Increase from previous day
Red: Decrease from previous day
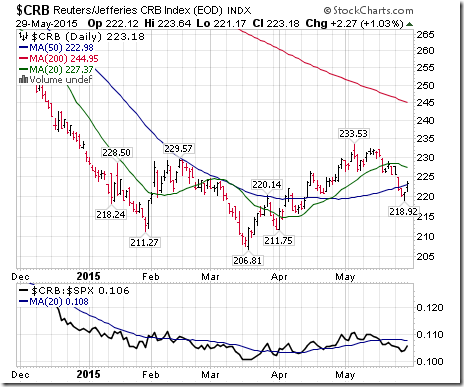
The CRB Index dropped 2.38 points (1.06%) last week. Intermediate trend remains neutral. The Index remains below its 20 day moving average. Strength relative to the S&P 500 Index remains negative. Technical score remains neutral. Technical score remains at 0.5. Short term momentum indicators remain down.
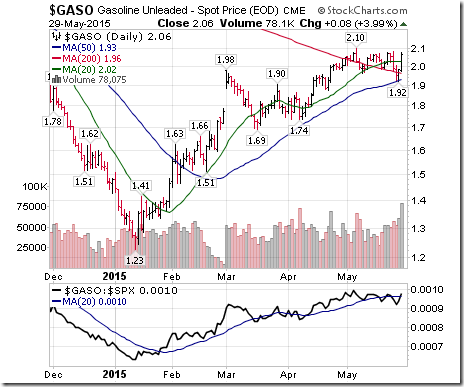
Gasoline added $0.02 per gallon (0.58%) last week. Intermediate trend changed to down from up. Gas moved above its 20 day moving average on Friday. Strength relative to the S&P 500 Index remains neutral. Technical score changed to 1.5 from 2.5 out of 3.0. Short term momentum indicators are mixed
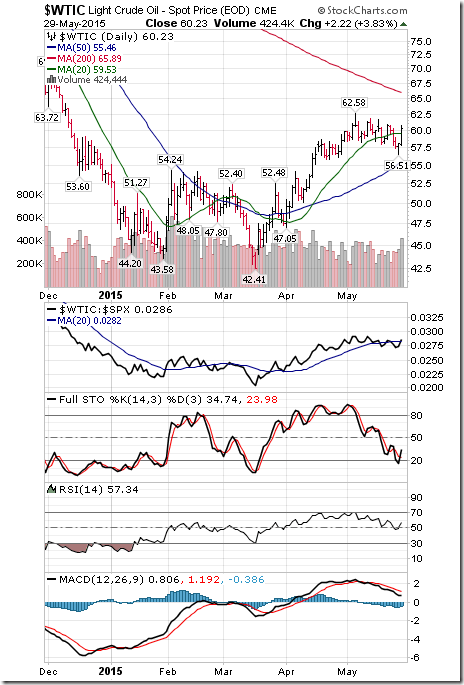
Crude oil added $0.51 (0.85%) last week. Intermediate trend changed to down from up. Crude moved above its 20 day moving average on Friday. Strength relative to the S&P 500 Index remains neutral. Technical score slipped to 1.5 from 2.5 out of 3.0. Short term momentum indicators are trending down.
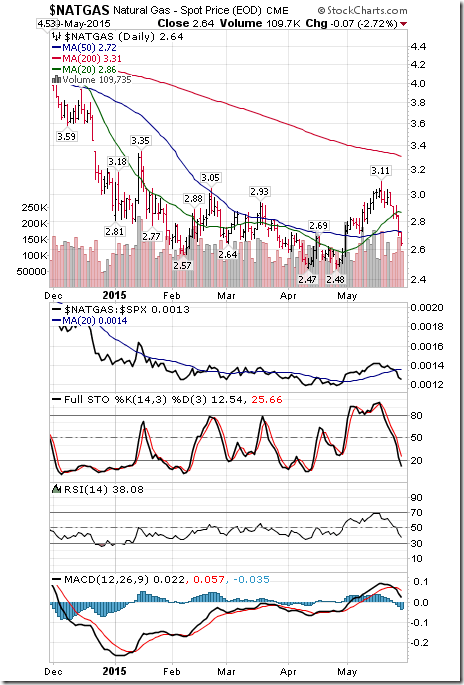
Natural Gas plunged $0.28 per MBtu (9.59%) last week. Intermediate trend remains up. Gas fell below its 20 day moving average. Strength relative to the S&P 500 Index changed to negative from positive. Technical score fell to 1.0 from 3.0 out of 3.0. Short term momentum indicators are trending down.
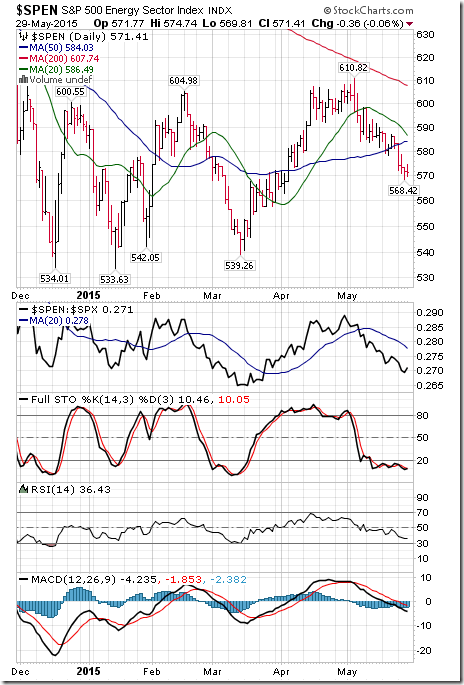
The S&P Energy Index fell 12.03 points (2.07%) last week. Intermediate trend remains up. The Index remains below its 20 day moving average. Strength relative to the S&P 500 Index remains negative. Technical score remains at 1.0 out of 3.0. Short term momentum indicators are trending down.
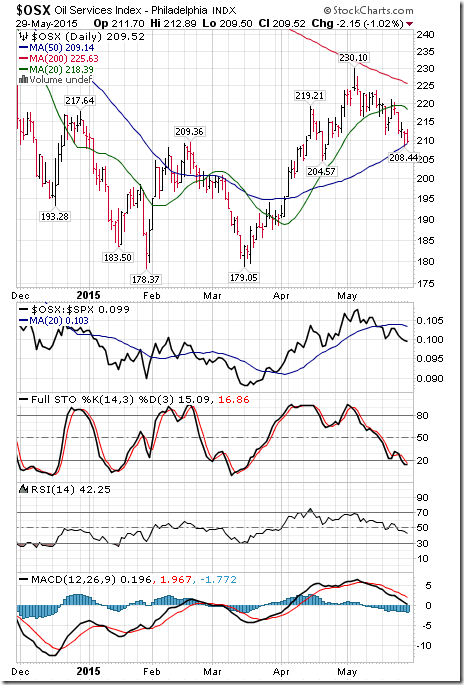
The Philadelphia Oil Services Index plunged 9.07 points (4.15%) last week. Intermediate trend remains up. The Index remains below its 20 day moving average. Strength relative to the S&P 500 Index remains negative. Technical score remained at 1.0 out of 3.0. Short term momentum indicators are trending.
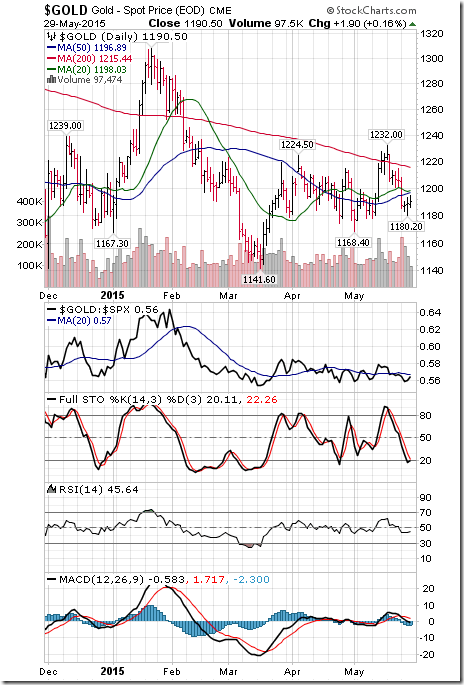
Gold fell $13.50 per ounce (1.12%) last week. Intermediate trend remains up. Gold moved below its 20 day moving average. Strength relative to the S&P 500 Index remains neutral. Technical score dropped to 1.5 from 2.5 out of 3.0. Short term momentum indicators are trending down.
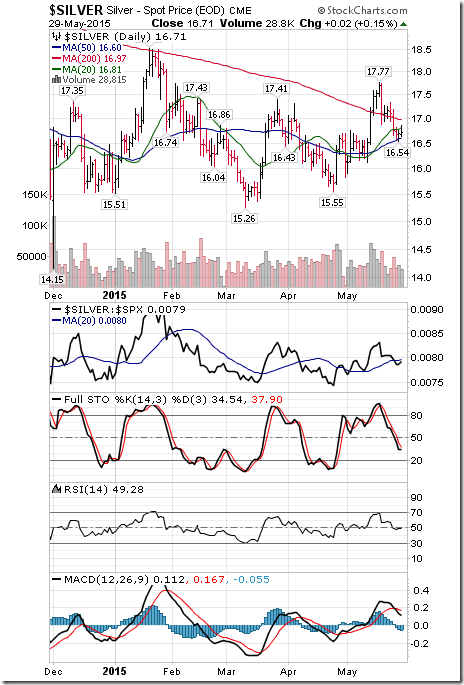
Silver dropped $0.34 per ounce (2.00%) last week. Intermediate trend remains up. Silver dropped below its 20 day moving average. Strength relative to the S&P 500 Index changed to neutral from positive. Technical score dropped to 1.5 from 3.0 out of 3.0. Short term momentum indicators are trending down. Strength relative to Gold remains neutral.
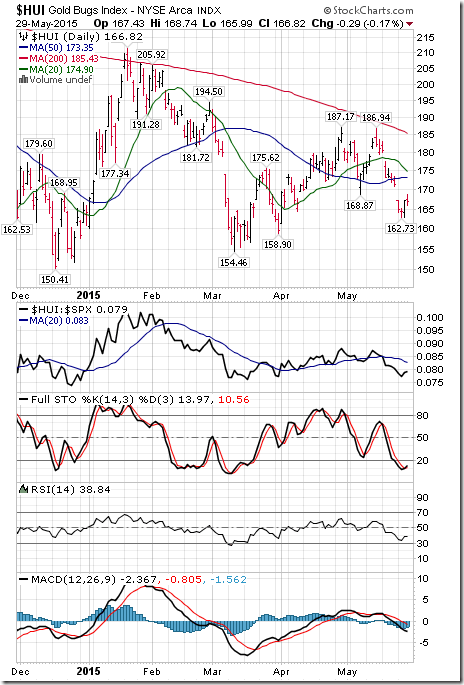
The AMEX Gold Bug Index dropped 4.46 points (2.60%) last week. Intermediate trend changed to Down from Up on a move below 168.87. The Index remains below its 20 day moving average. Strength relative to the S&P 500 Index remains negative. Technical score dropped to 0.0 from 1.0 out of 3.0. Short term momentum indicators are trending down. Strength relative to the S&P 500 Index remains negative.
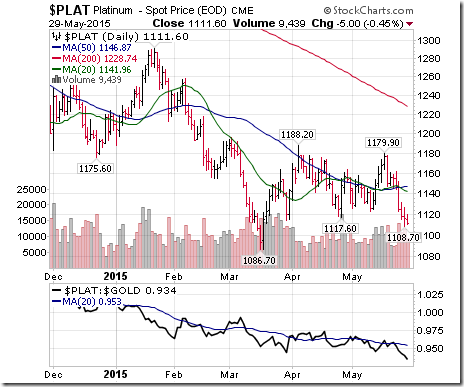
Platinum dropped $37.00 per ounce (3.22%) last week. Trend remains down. PLAT remains below its 20 day moving average. Strength relative to S&P 500 Index turned negative.
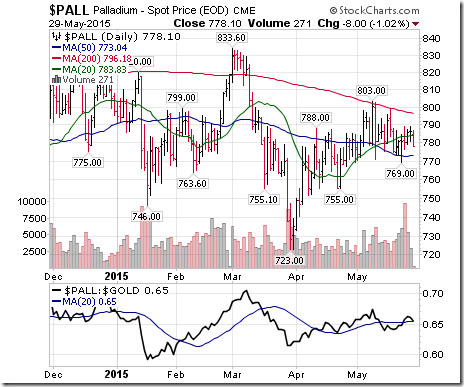
Palladium fell $9.90 per ounce (0.75%) last week. Trend remains up. PALL dropped below its 20 day moving average. Strength relative to S&P 500 Index remains neutral. Strength relative to Gold remains neutral.
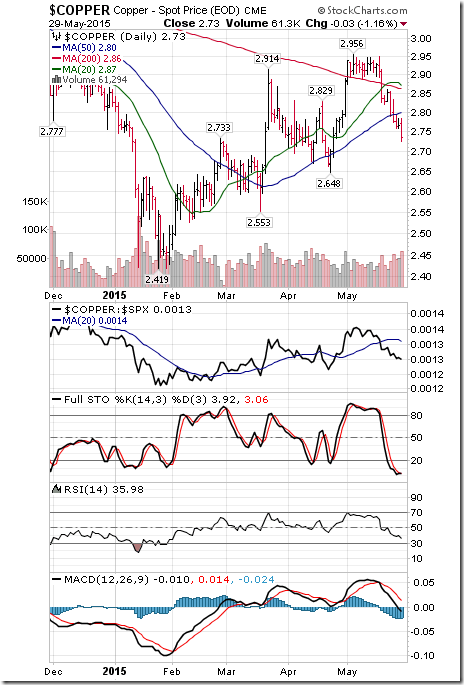
Copper dropped $0.08 per lb. (2.85%) last week. Intermediate trend remains up. Copper remains below its 20 day moving average. Strength relative to the S&P 500 Index remains negative. Technical score remains at 1.0 out of 3.0.Short term momentum indicators are trending down.
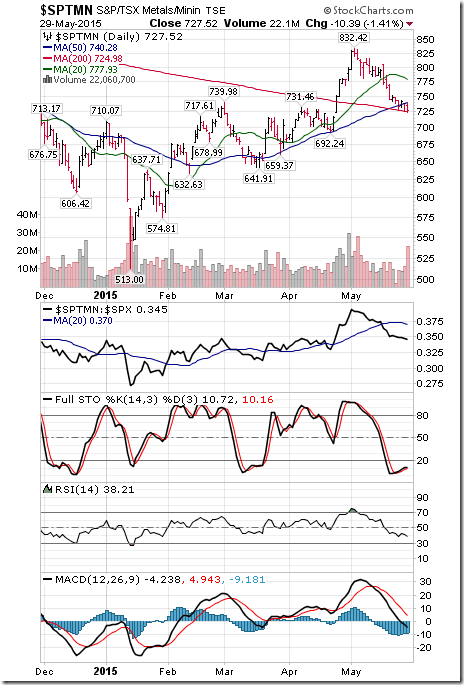
The TSX Metals & Minerals Index fell another 19.84 points (2.65%) last week. Intermediate trend remains up. The Index remains below its 20 day moving average. Strength relative to the S&P 500 Index remains at 1.0 out of 3.0. Short term momentum indicators are trending down.
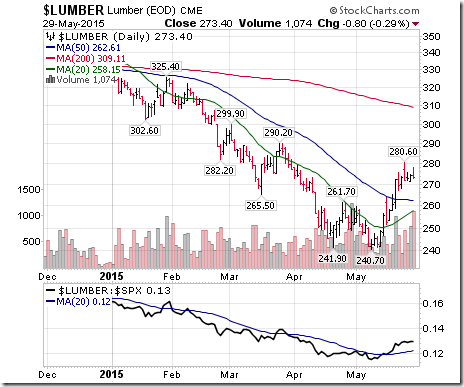
Lumber slipped $0.40 (0.15%) last week. Intermediate trend remains neutral. Lumber remains above its 20 day moving average. Strength relative to the S&P 500 Index remains positive.
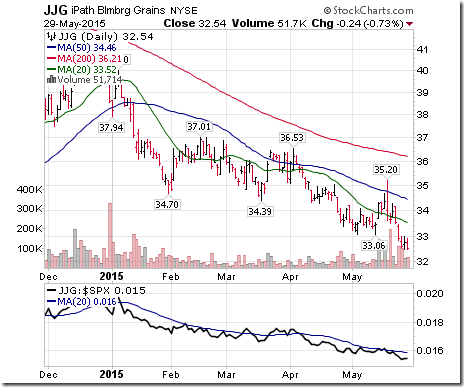
The Grain ETN fell $0.99 (2.95%) last week. Intermediate trend remains down. Units remain below their 20 day moving average. Strength relative to the S&P 500 Index changed to negative
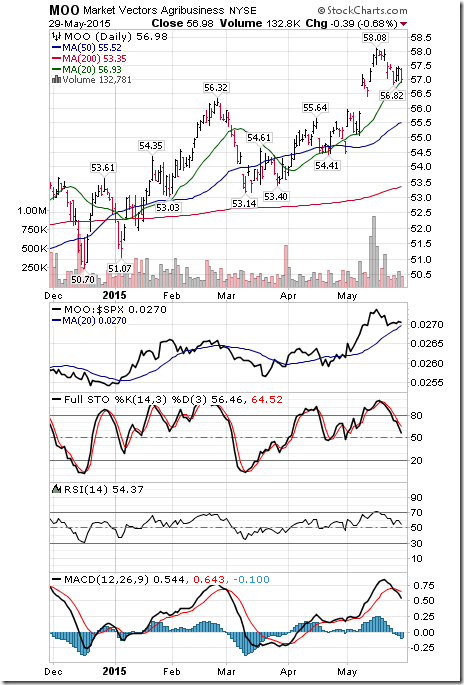
The Agriculture ETF dropped $0.45 (0.78%) last week. Intermediate trend remains up. Units remain above their 20 day moving average. Strength relative to the S&P 500 Index remains positive. Technical score remains at 3.0 out of 3.0. Short term momentum indicators are trending down.
Interest Rates
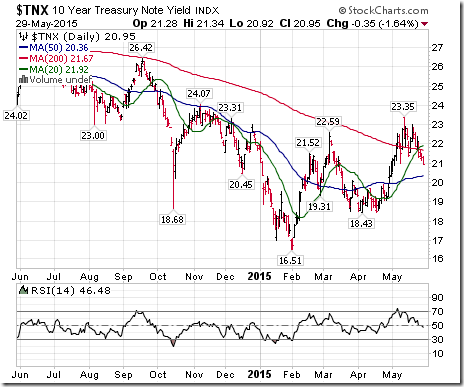
The yield on 10 year Treasuries fell 12 basis points (5.42%) last week. Intermediate trend remains up. Yield fell below its 20 day moving average. Short term momentum indicators are trending down.
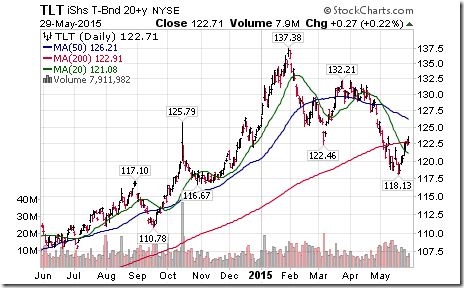
Conversely, price of the long term Treasury ETF added $2.31 (1.92%) last week. Intermediate trend remains down. Units moved above their 20 day moving average. Short term momentum indicators are trending up.
Other Issues
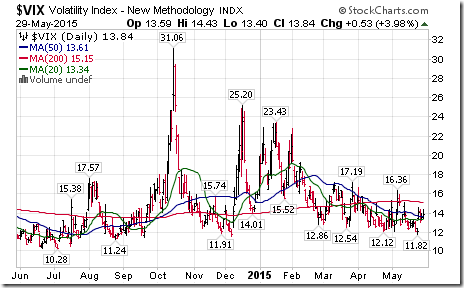
The VIX Index jumped 1.71 (14.10%) last week, typical of start of a correction during the summer.
Following is a comment used on BNN’s Market Call Tonight on Friday:
When will the summer rally occur? As June is entered, the media love to ask the question. Not so fast! Granted, the S&P 500 Index and TSX Composite has recorded a period of significant strength from the beginning of June to the end of October in every year during the past 10 periods except 2008 when the U.S. equity market was in a free fall. However, the timing of the rally is any time during the five month period. Trying to determine precise timing during the next five months is like trying to “nail Jello to the wall”. Of greater importance, every summer rally occurred AFTER a spike in volatility (i.e. VIX) and a correction ranging from 6% to 13%. Triggers to the spike in volatility have been non-recurring events. Possible triggers this year include the first increase in the Fed Fund rate and bankruptcy by Greece. Currently, the VIX Index is dragging near a five year low and has yet to show momentum signs of moving higher. The S&P 500 Index and TSX Composite can drift higher under current conditions. However, be aware that when VIX begins to spike, the correction happens quickly. Last year the S&P 500 Index dropped 9.8% and the TSX Composite plunged 13.0% from mid-September to mid-October. Investors need to be vigilant as summer approaches. The good news: after the correction is over, the summer rally occurs and gains frequently continue until the end of the year.
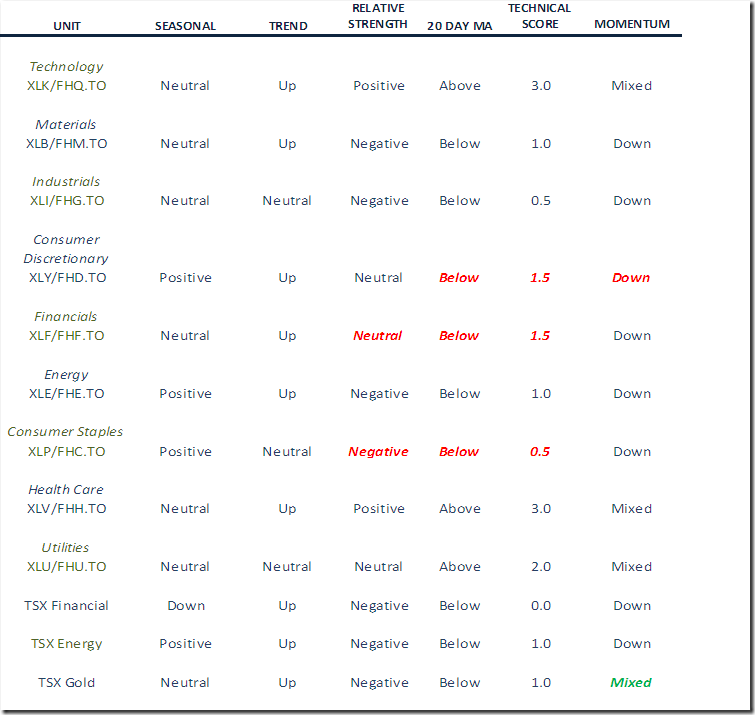
Short and intermediate technical indicators have rolled over for most equity indices and sectors. In addition, more individual S&P 500 stocks broke support (24) than broke resistance (7). Notable among stocks breaking support were Consumer Discretionary and Transportation stocks.
The month of June is one of the weakest performing months in the year for equity markets around the world. During the past 64 years, June was the second weakest month for the Dow Jones Industrial Average and the fourth weakest month for the S&P 500 Index. During the past 29 years, June was the second weakest month for the TSX Composite Index. European equity markets also are notably weaker in June. Precious and base metal prices (other than copper) also were notably weaker. Strongest sectors in June during the past 24 years were Health Care, Telecom and Information Technology. Weakest sectors were Materials, Financials and Consumer Discretionary.
Earnings and revenues by S&P 500 companies are expected to remain under pressure during at least the next two quarters. According to FactSet, consensus second quarter estimates show a year-over-year decline of 4.4% for earnings and 4.5% for revenues. Consensus third quarter estimates show a year-over-year decline of 0.5% for earnings and 2.5% for revenues. Strength in the U.S. Dollar Index is the most frequent reason cited for the declines. Sectors that reported the most frequent decline in guidance were Information Technology, Consumer Discretionary and Industrials.
Economic data this week is expected to confirm that the U.S. economy has started to recover from a weather related slowdown during the first four months of 2015. Focus this week is on the May employment report to be released on Friday.
International events could influence equity markets this week. The focus is on Greece and its potential foreclosure.
Sectors
Daily Seasonal/Technical Sector Trends for May 29th
Green: Increase from previous day
Red: Decrease from previous day
StockTwits Released on Friday
Technical action to 10:45 AM: Quietly bearish. Breakouts: $GME, $LLY. Breakdowns: $IPG, $A, $CSX, $URI, $PCAR.
Technical Action by Individual Equities on Friday
After 10:45 AM another 12 S&P 500 stocks broke support and two stocks broke resistance (Boston Scientific, Humana).
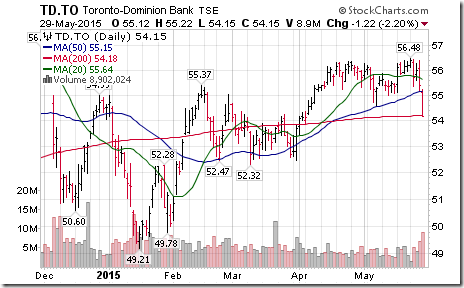
Among TSX 60 stocks, TD Bank broke support.
Special Free Services available through www.equityclock.com
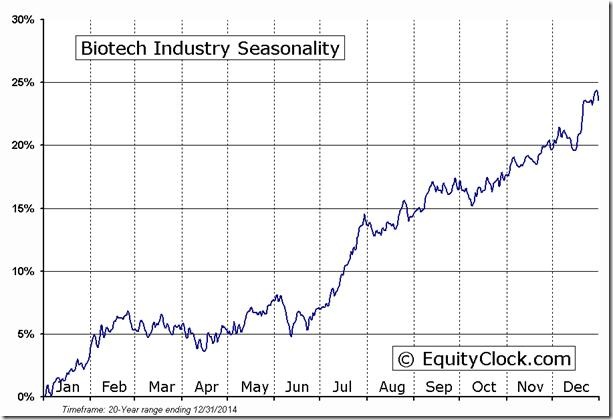
Equityclock.com is offering free access to a data base showing seasonal studies on individual stocks and sectors. The data base holds seasonality studies on over 1000 big and moderate cap securities and indices. To login, simply go to http://www.equityclock.com/charts/
Following is an example:
Disclaimer: Comments, charts and opinions offered in this report by www.timingthemarket.ca and www.equityclock.com are for information only. They should not be considered as advice to purchase or to sell mentioned securities. Data offered in this report is believed to be accurate, but is not guaranteed. Don and Jon Vialoux are Research Analysts with Horizons ETFs Management (Canada) Inc. All of the views expressed herein are the personal views of the authors and are not necessarily the views of Horizons ETFs Management (Canada) Inc., although any of the recommendations found herein may be reflected in positions or transactions in the various client portfolios managed by Horizons ETFs Management (Canada) Inc.
Individual equities mentioned in StockTwits are not held personally or in HAC.
Horizons Seasonal Rotation ETF HAC May 29th 2015
Copyright © Don Vialoux, EquityClock.com


![clip_image002[6] clip_image002[6]](https://advisoranalyst.com/wp-content/uploads/HLIC/072ca43ffbdc4c4b8df510316f90630d.png)
