by Ryan Lewenza, CFA, CMT, Private Client Strategist, Raymond James
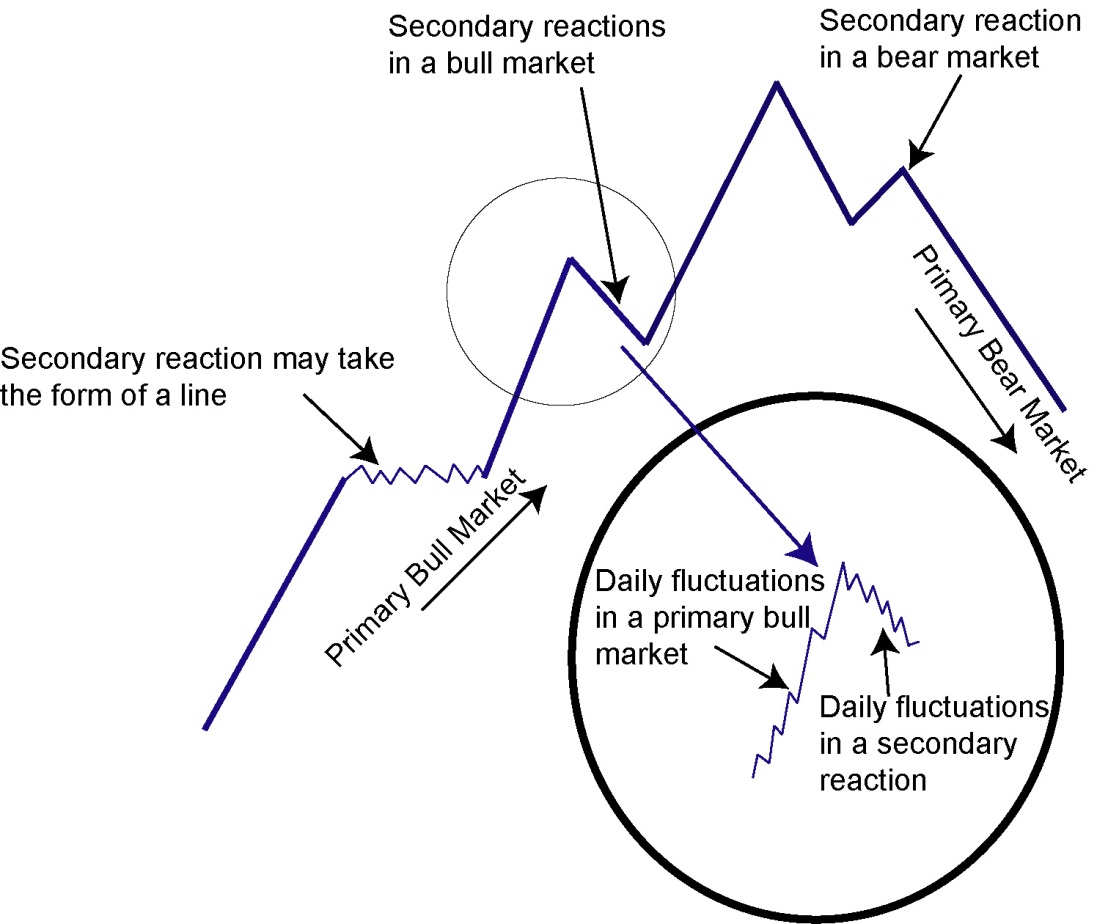
• Dow Theory is a branch of technical analysis which examines the price action of the Dow Jones Industrial Average (Industrials) and Dow Jones Transportation Average (Transports). When the two indices are in uptrends and are both “in sync” with each other it is a sign of market strength. Conversely, when the indices are in downtrends or are diverging with each other, as is currently the case, it can provide an early warning signal of a change in market trend.
• The Transports have been weak as of late, with the index down 6.4% year-to-date (YTD) versus the Industrials which are up 1.9%. More importantly, the Transports broke below technical support of roughly 8,550, with many pointing to this breakdown as a Dow Theory “non-confirmation” and a harbinger of weakness ahead for the equity markets.
• Dow Theory is currently flashing an “amber warning” signal rather than a “sell signal” based on the divergence between the Transports and Industrials. An official Dow Theory “sell signal” would be generated if the Industrials were to drop below 17,068. Until then, all we have is a “non-confirmation” which requires close monitoring but is no reason to sell en masse.
• Moreover, the preponderance of technical evidence remains bullish which includes: 1) the S&P 500 Index (S&P 500) remains in a long-term uptrend and above its rising 40-week moving average (MA); 2) market breadth remains positive with the NYSE Advance/Decline (A/D) line making new highs; 3) global equity breadth remains positive with numerous global bourses hitting new highs; and 4) a number of market cycles we track are bullish for 2015.
Read/Download the complete report below:


