by Don Vialoux, EquityClock.com

**NEW** As part of the ongoing process to offer new and up-to-date information regarding seasonal and technical investing, we are adding a section to the daily reports that details the stocks that are entering their period of seasonal strength, based on average historical start dates. Stocks highlighted are for information purposes only and should not be considered as advice to purchase or to sell mentioned securities. As always, the use of technical and fundamental analysis is encouraged in order to fine tune entry and exit points to average seasonal trends.
Stocks Entering Period of Seasonal Strength Today:
-
No stocks identified for today
The Markets
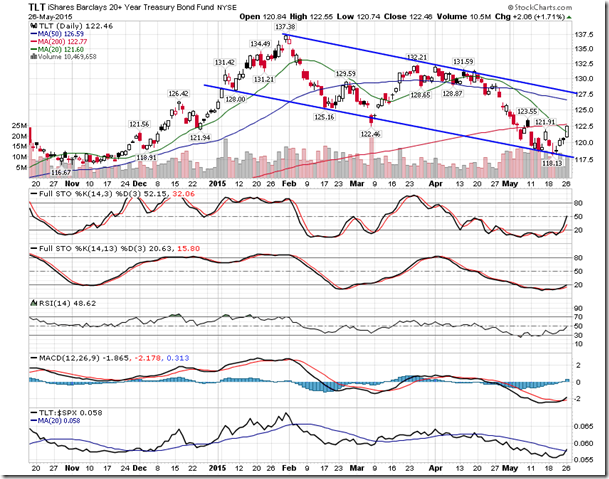
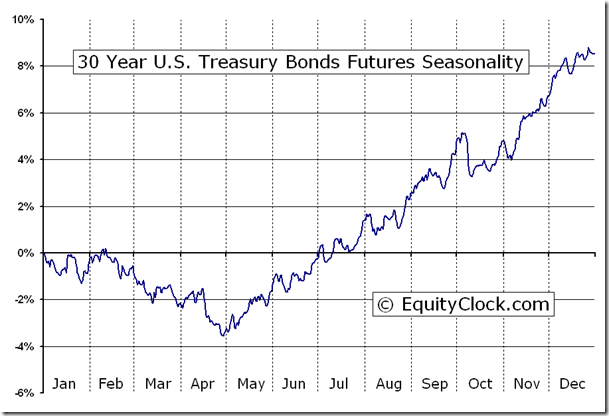
Stocks plunged on Tuesday with the S&P 500 Index closing lower by over one percent. Investors cited concerns pertaining to the better than expected economic data increasing the probability of a near-term fed funds rate increase, however, the validity of the argument was questionable given the rally in bond prices. One of the more actively traded treasury bond ETFs, TLT, gained 1.71% during the session, instantly rebounding from oversold levels and triggering a bullish crossover with respect to MACD. Negative momentum divergences and an emerging trend of lower-highs and lower-lows at this point suggests nothing more than a rebound rally. Trend-channel resistance is apparent around $128. Seasonally, bonds are within a period of strength that runs from the start of May through to October.
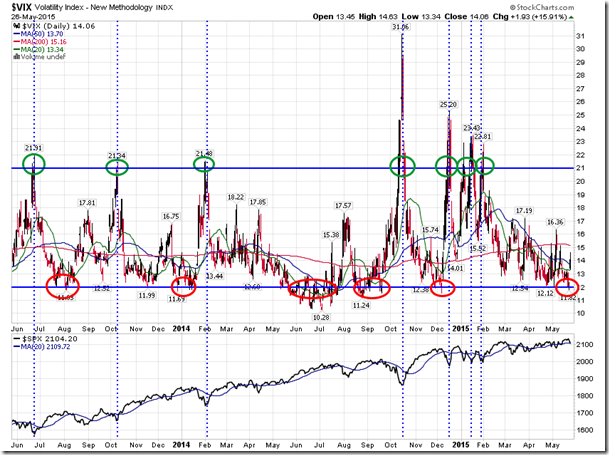
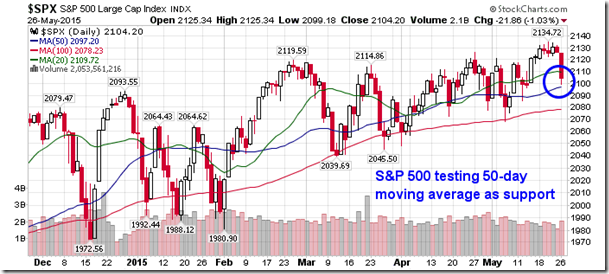
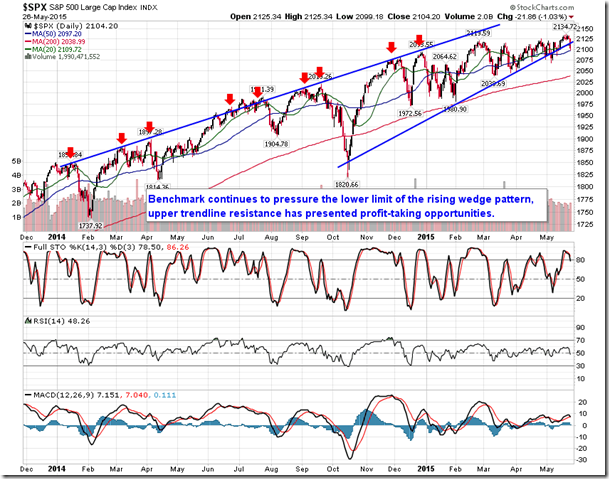
The selloff in equities following the long weekend coincided with signs of complacency during Friday’s session. The volatility Index hit levels below 12 at the end of last week, a level that has coincided with short-term peaks in equity prices, based on recent history. If you’ve followed our work for a while, you’ve probably seen the below chart where we’ve highlighted the “12” and “21” levels; the lower level represents complacency, a level that has offered opportunities to hedge portfolio positions, and the other represents excessive fear, often conducive to accumulating equity positions. The S&P 500 Index is now testing support at its 50-day moving average as the benchmark retraces the gains accumulated in the run-up to the holiday weekend; investors were clearly re-initiating short-allocations following Monday’s market closure. With the last trading days of the month ahead, investors will once again be squaring away positions prior to the change in the calendar, potentially limiting downside potential over the near-term. Support remains apparent around the 100-day moving average.
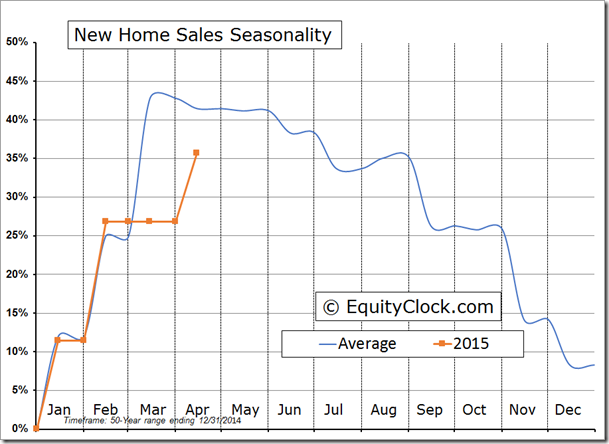
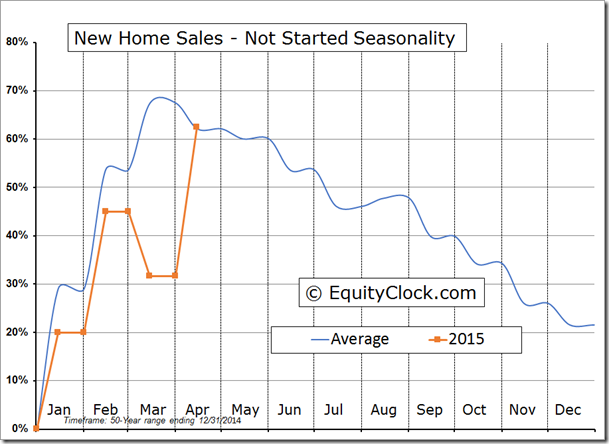
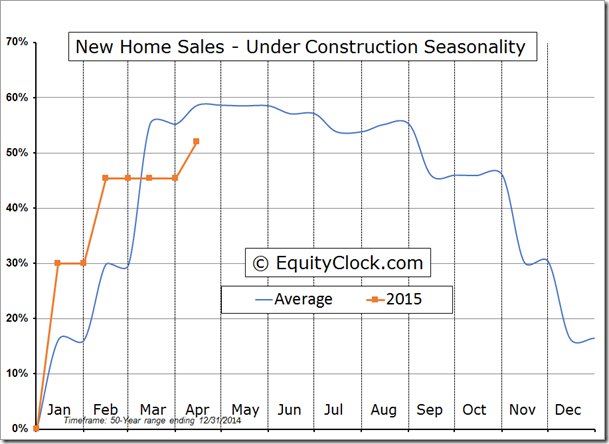
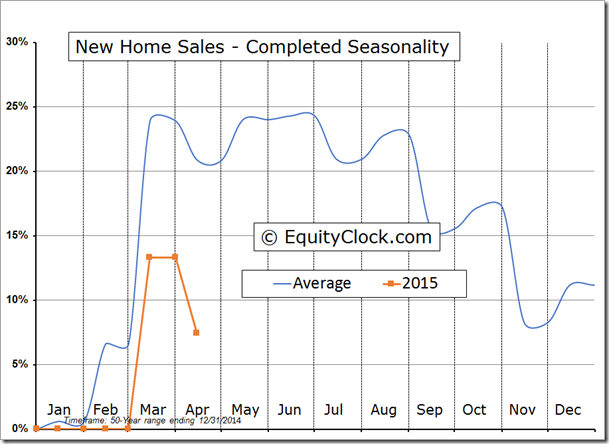
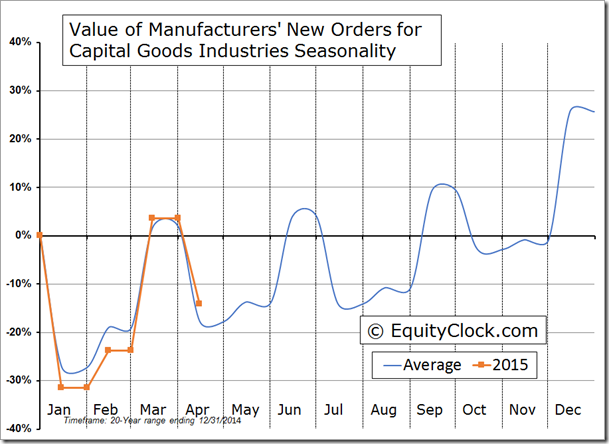
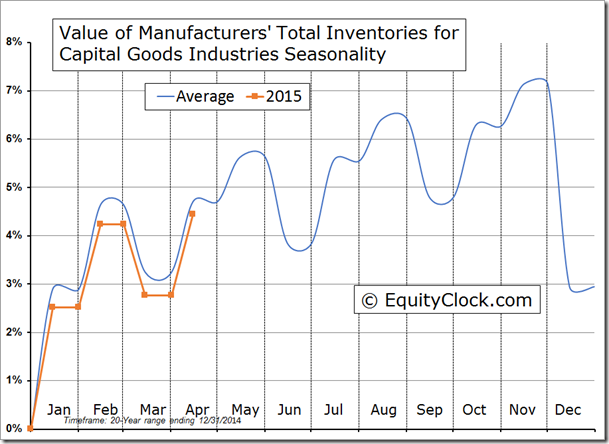
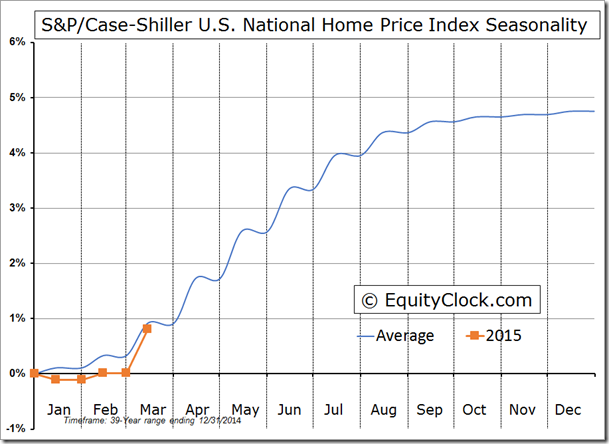
The flood of economic data released on Tuesday gave investors plenty to discuss. Not only did the economic data beat expectations, the results also exceeded the month-to-month average change as the economy attempts to recoup the lost activity that resulted from the adverse winter weather in the US Northeast. Stripping out seasonal adjustments, New Home Sales increased by 8.9%, beating the average April decline of 1.3%; New Orders for Capital Goods declined by 17.7%, beating the average April decline of 19.5%; the Case-Shiller National House Price Index advanced by 0.8%, exceeding the average March gain of 0.6%. Versus the seasonal trend through the first few months of the year, the results remain mixed. The trend for durable goods orders is above average, while the year-to-date change in house prices is inline. New Home Sales remain the laggard, showing results 5.7% below the average change through the first four months of the year. As we’ve seen in other reports pertaining to housing, the year-to-date change remains tepid, potentially vulnerable to the impact that a rate increase would have on this segment of the economy. Digging further, the lag in new home sales through the month of April can be attributed to houses either completed or under construction; houses not started, which are based on plans, is inline with the average seasonal trend. The side effect from this trend may spill over to the spring buying season for big ticket items, such as appliances and furniture, as fewer moves are conducted into these ready or soon-to-be ready homes. Bottom line is that despite a recent pickup in economic data, measuring the results against their average seasonal trends shows little evidence of an overheating economy and the US Fed may want to think twice about implementing measures to cool economic growth, such as a rate increase.
New Home Sales
Durable Goods Orders
Case-Shiller House Price Index
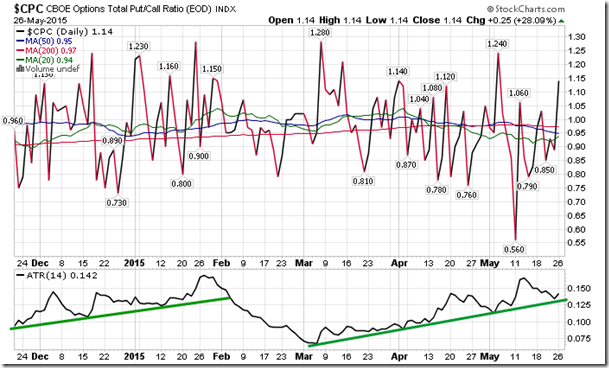
Sentiment on Tuesday, as gauged by the put-call ratio, ended bearish at 1.14. The average true range continues to trend higher, suggesting increasing investor uncertainty.
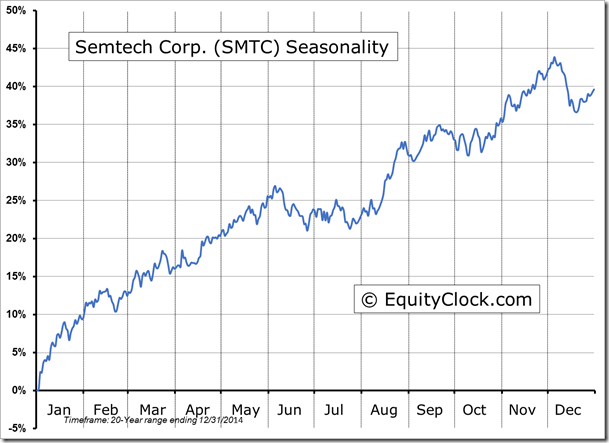
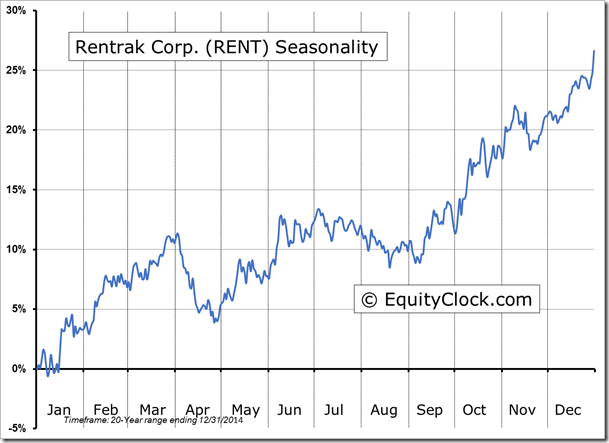
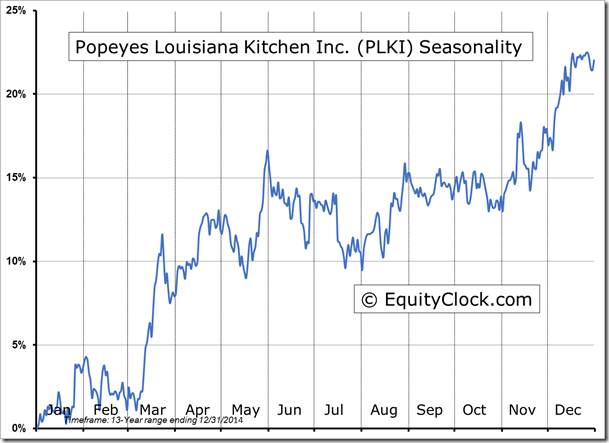
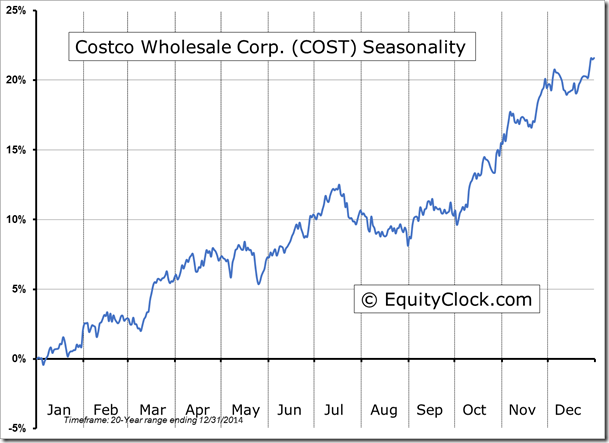
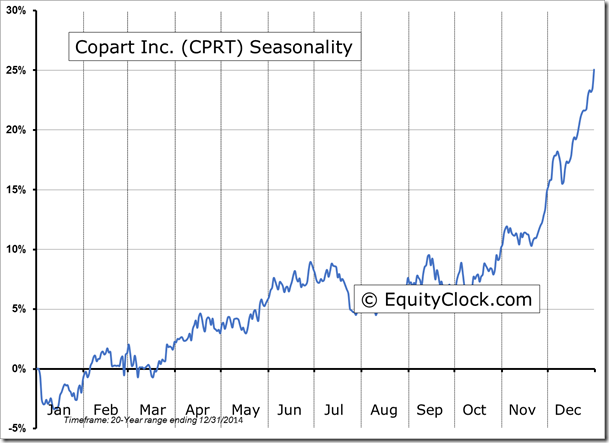
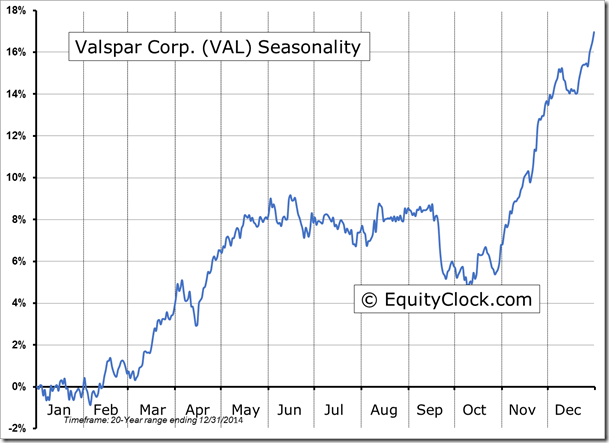
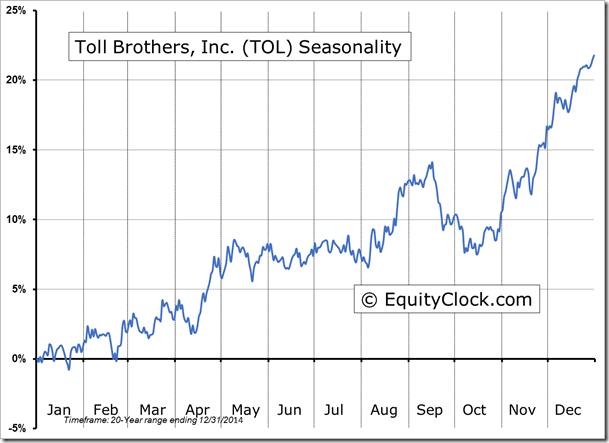
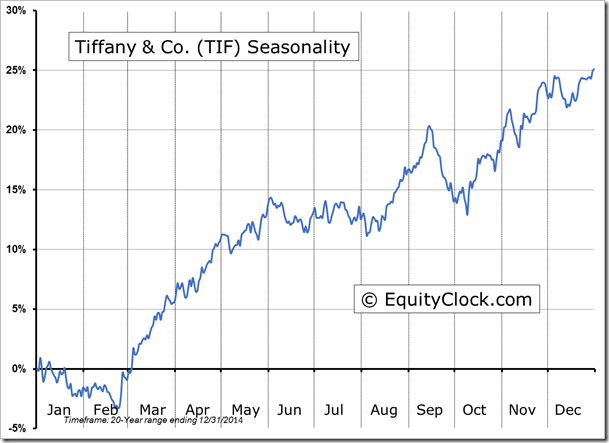
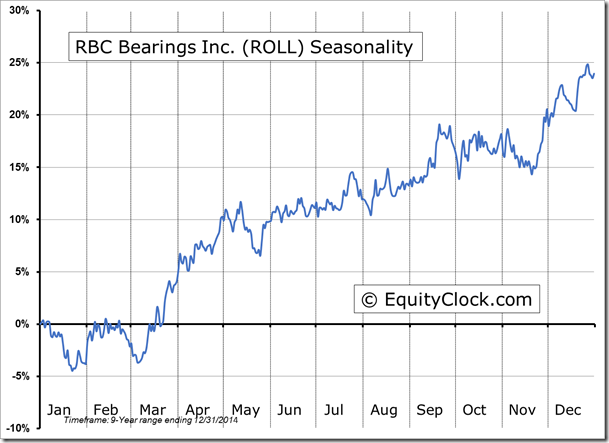
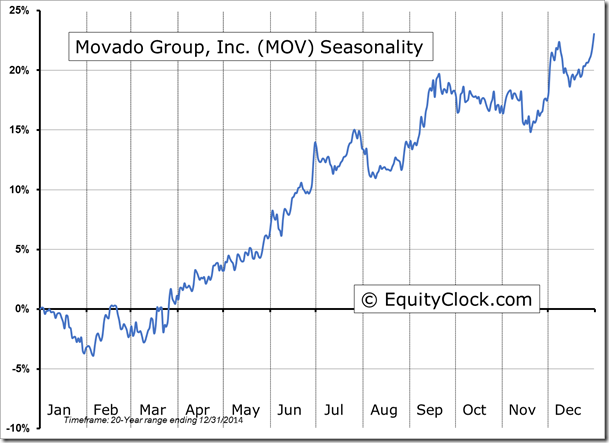
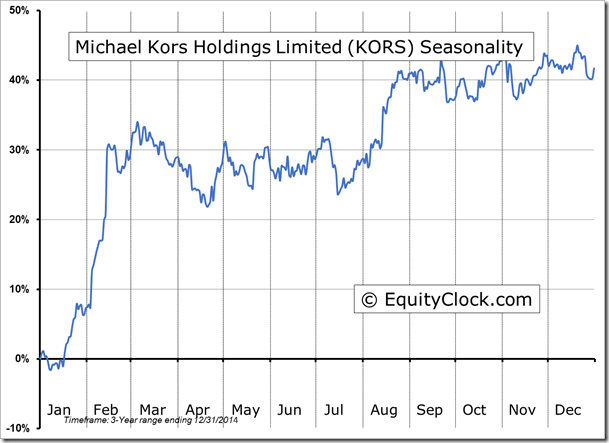
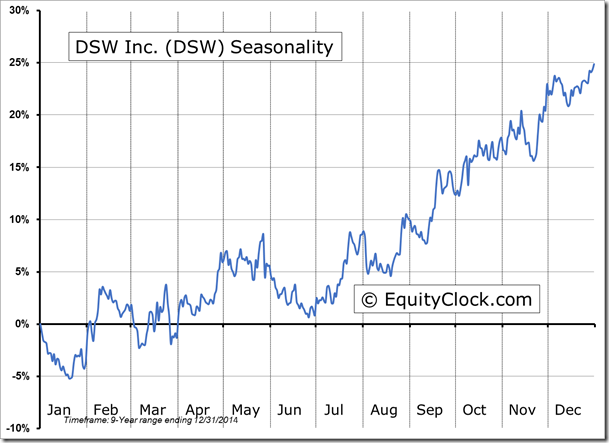
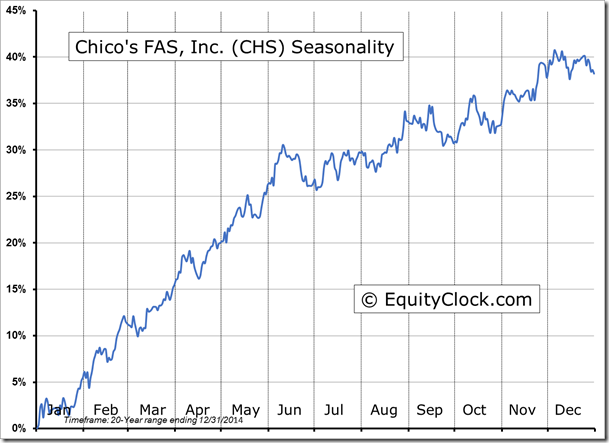
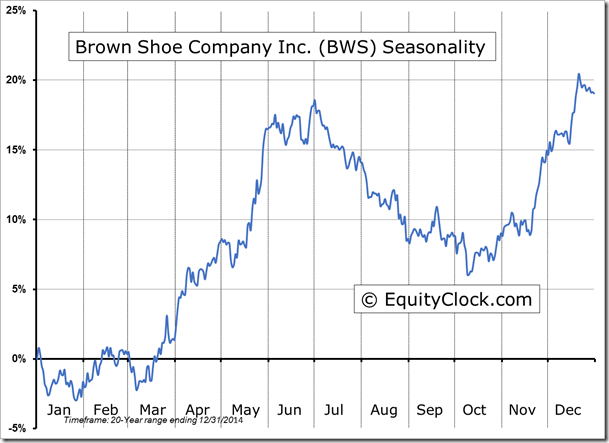
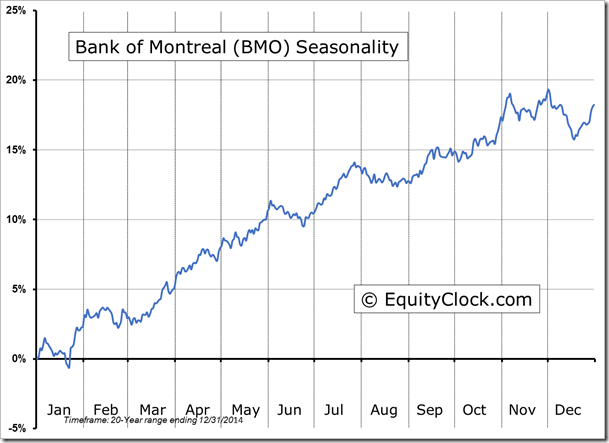
Seasonal charts of companies reporting earnings today:
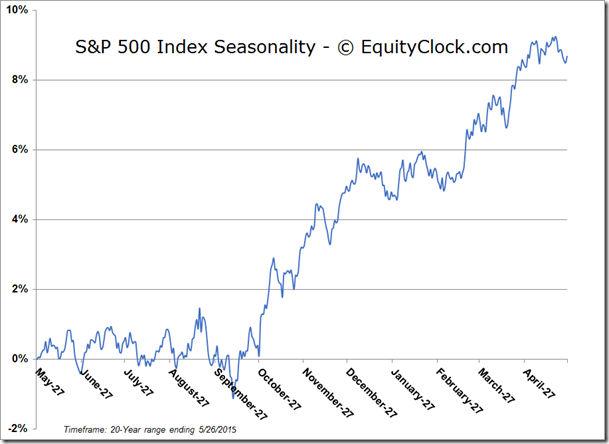
S&P 500 Index
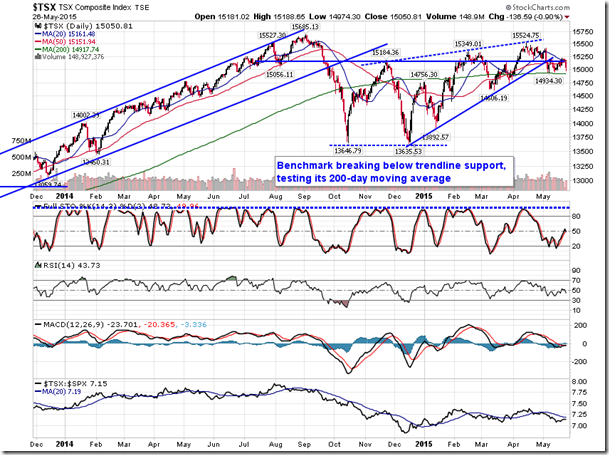
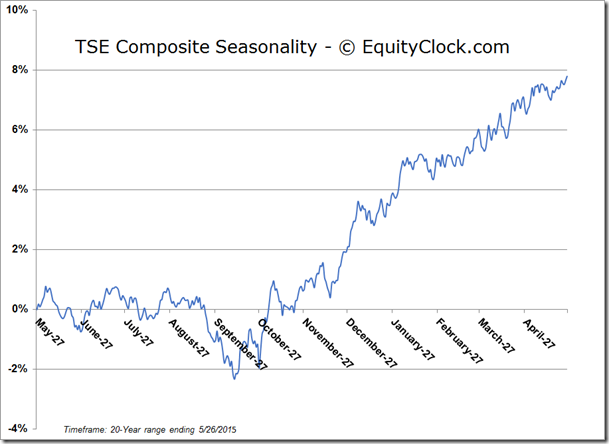
TSE Composite
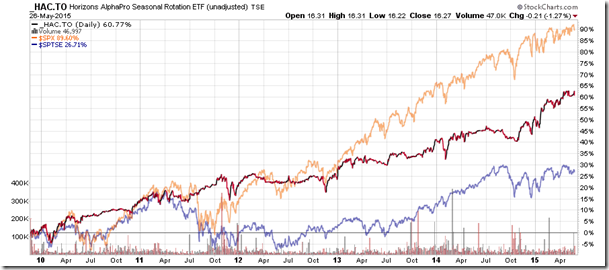
Horizons Seasonal Rotation ETF (TSX:HAC)
- Closing Market Value: $16.27 (down 1.27%)
- Closing NAV/Unit: $16.28 (down 0.28%)
Performance*
| 2015 Year-to-Date | Since Inception (Nov 19, 2009) | |
| HAC.TO | 7.60% | 62.8% |
* performance calculated on Closing NAV/Unit as provided by custodian
Click Here to learn more about the proprietary, seasonal rotation investment strategy developed by research analysts Don Vialoux, Brooke Thackray, and Jon Vialoux.
Copyright © Don Vialoux, EquityClock.com


