For this week's SIA Equity Leaders Weekly, we are going to revisit an article we wrote over a year ago as we think it helps to address one of the most misleading statistics told to your clients on a regular basis. This was written on March 27, 2014.
In this week’s edition of the SIA Equity Leaders Weekly, we are going to examine one of the most common but misleading statistics put forth by the supporters of the “Buy and Hold” approach … namely “Missing the Best 10 days” argument. First, this argument suggests that market returns are random and unpredictable. Second, if you missed the “Best 10 Days” in the markets your returns would be substantially lower than if you were continually invested. Therefore, since the best 10 days are such rare occurrences but the impact of missing them is so substantial to your returns, the only prudent approach to ensure you are in the market for these “best days” is to stay continually invested. Why is this so misleading?
“Missing the Best 10 Days” Myth
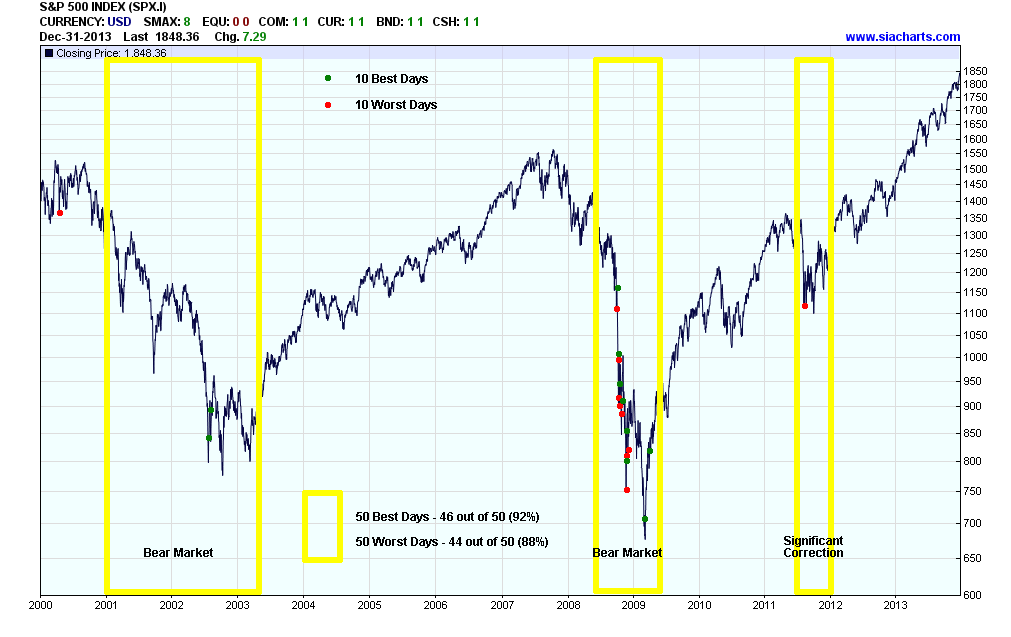
Despite the belief by many in the “Buy and Hold” camp that market returns and volatility are random and unpredictable events, the evidence shows what is referred to as “volatility clustering” which is when extreme upside and downside volatility occur within close proximity to each other. More specifically, we find that the vast majority of extreme up and down days occur in Bear Markets. This happens because volatility increases significantly in Bear Markets due to investor psychology as emotions get amplified. The chart shows the Best 10 Days (Green dots) and the Worst 10 Days (Red dots) in the S&P500 Index from January 1, 2000 to December 31, 2013. As you can see 19 of the 20 Best/Worst Days occurred in the 2 Bear Markets of 2001–2003 and 2008-2009, and the significant 2011 correction. If this isn’t evidence enough of “volatility clustering”, we can even expand our analysis to look at the Best/Worst 50 Days. The yellow rectangles represent the Bear Market/Correction periods during this timeframe and shows that 46 of the 50 Best Days (92%) and 44 of the 50 Worst Days (88%) occurred during these huge market declines.
So the misleading part of the “Missing the Best 10 Days” argument is that in order to get the majority of the best days, you not only have to experience the majority of the worst days in close proximity but you also HAVE TO BE CONTINUALLY INVESTED THROUGHOUT THE BEAR MARKETS!
Click on Image to Enlarge
Relative Strength Solution
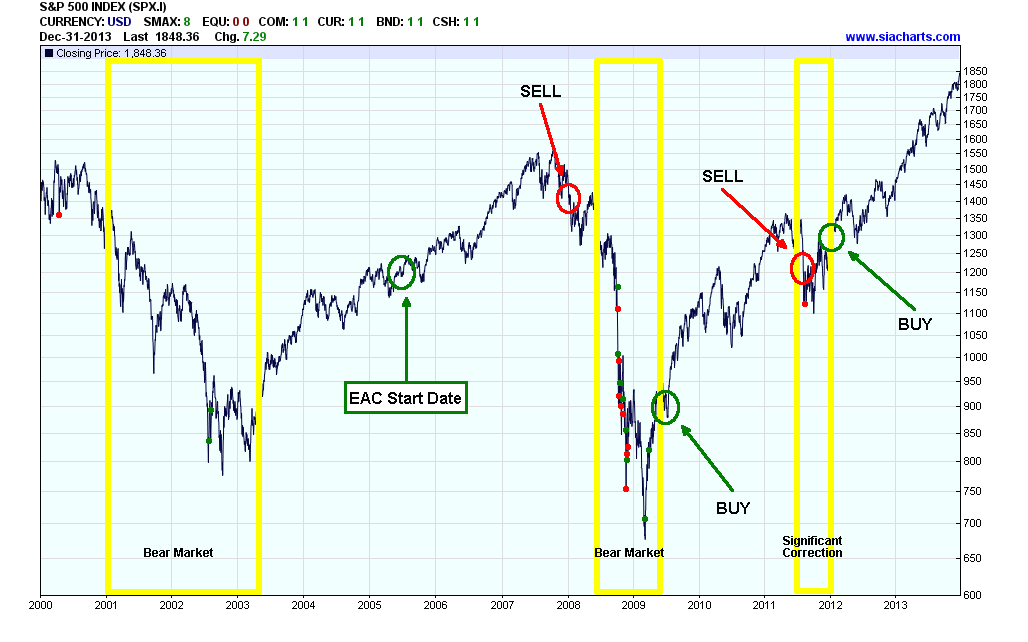
As we have shown, the focus on trying to be invested during the “Best Days” is flawed because not only do Best & Worst Days tend to cluster together in terms of timeframe, but they also overwhelmingly occur during Bear Markets. What is more important to focus on is the “Best & Worst Periods” or what is commonly referred to as “Bull & Bear Market Cycles”. These cycles are not random and completely unpredictable as one cycle inevitably follows the next. Timing the exact “tops” and “bottoms” for these cycles is not the goal, but understanding how to navigate through them is more important to your long-term returns than worrying about “missing the best days”. The focus is not on trying to “time” the market, but rather to “align” ourselves with the market by using a Rules-Based, Objective, Unbiased and Unemotional approach to investing. Relative Strength enables us to objectively determine the supply/demand characteristics of the markets by tracking the money flows on a large scale. This enables us to “align” ourselves with the market and adapt our strategy to the changing market conditions. We have developed a proprietary Relative Strength indicator that helps us to track the strength or weakness of the Equity Markets vs alternative Asset Classes over time, we call it the “Equity Action Call” (EAC). The start date for this indicator was mid-2005 and was on a “Buy” signal for the Equity Markets at that time. Then on January 2008, the EAC indicated a move to Cash and remained there until May 2009 when the EAC indicated a move back into equities again. Another “Sell” Signal occurred in August 2011 followed by a “Buy” Signal in January 2012. What is so powerful about this approach is that you can outperform even after missing the “Best Days” in the markets, IF you are able to reduce your exposure to the “Worst Periods” in the markets!
Click on Image to Enlarge
SIACharts.com specifically represents that it does not give investment advice or advocate the purchase or sale of any security or investment. None of the information contained in this website or document constitutes an offer to sell or the solicitation of an offer to buy any security or other investment or an offer to provide investment services of any kind. Neither SIACharts.com (FundCharts Inc.) nor its third party content providers shall be liable for any errors, inaccuracies or delays in content, or for any actions taken in reliance thereon.
For any questions on this article, please call or email us at 1-877-668-1332 or siateam@siacharts.com.