For this week's SIA Equity Leaders Weekly, we are going to focus on the Energy sector. In Canada, the Energy sector makes up ~22% of the weight in the TSX and saw a big one-day loss yesterday on political news while crude oil rose to new highs in 2015. In the U.S., the relationship between Oil Stocks and Crude Oil may be changing as well or is it a false move?
iShares S&P/TSX Capped Energy ETF (XEG.TO)
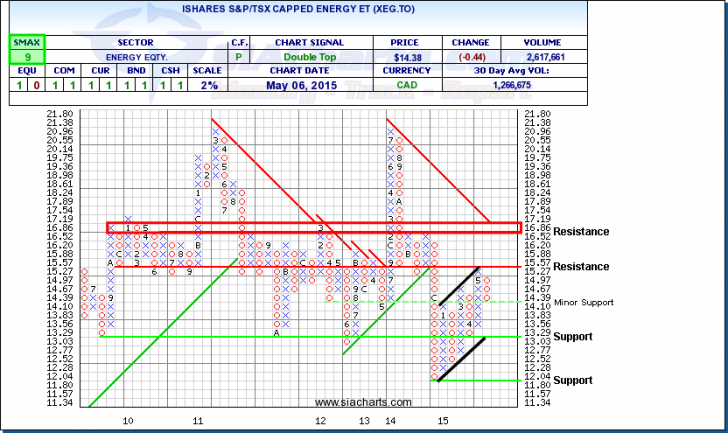
On a day when Crude Oil hit new highs for 2015, usually energy stocks follow suit, but news out of Alberta’s political election caused XEG.TO (iShares S&P/TSX Capped Energy ETF) to drop ~3% yesterday. The New Democratic Party (NDP) beat out the Progressive Conservative party for the first time in 44 years leading many to speculate on policy changes that could affect corporate taxes or other issues of many energy corporations headquartered in the province. Alberta is also the largest source of U.S. oil imports.
Looking at the chart of XEG.TO, it had moved up to the resistance level at $15.57 before reversing down to support at $14.10. Further weakness could see the support level at $13.03 come into play. To the upside, if the near-term strength continues, which XEG.TO had been showing to start the year with an SMAX score of 9, resistance above around $16.50-$17.19 could come into play. Commodities as an asset class and the energy sector within SIACharts are still showing relative weakness compared to other asset classes and sectors from a long-term perspective as a higher risk area overall.
Click on Image to Enlarge
Crude Oil Vs. iShares Oil & Gas Index ETF (CL.F ^ IEO)
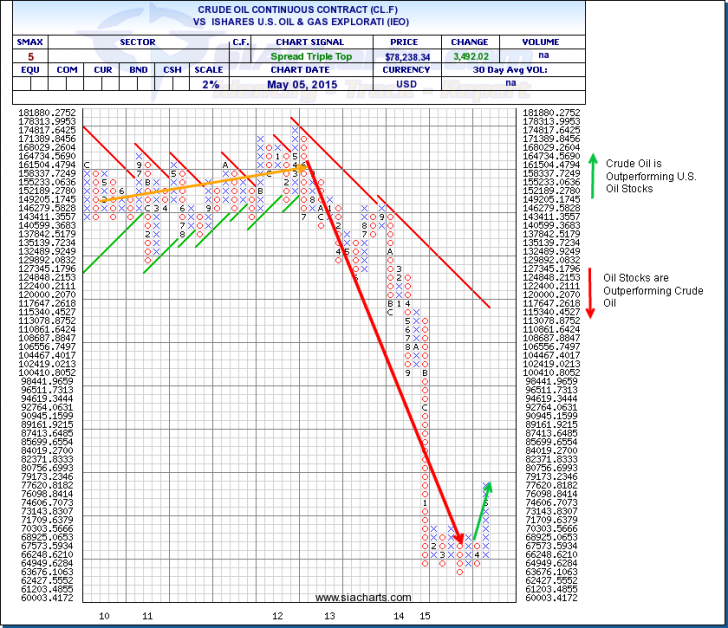
Now we are going to take a look at U.S. Energy Sector and the comparison between Oil Stocks and Crude Oil’s relative performance. The dominance in the U.S. side has been in favor of U.S. Equities since the summer of 2012 which you can see in the comparison chart with the red downward arrow. While the small green arrow may be soon signaling a change in this relationship, it is still early in this relationship to see if long-term strength has truly swung back in favor of buying Crude Oil in favor of Oil Stocks in general. The VS SMAX score of 5 shows it currently as a tie with short-term strength of the Crude Oil Commodity battling it out with the long-term strength of Oil Stocks to decide the relative strength winner. If this relationship is important to your trading for a long/short strategy or which side you would rather be exposed to in this area, keep a close eye on this chart to see which direction this relationship breaks out into as it is currently at a crossroads.
With Crude Oil hitting a new high in 2015, the commodity is still down ~40% over the last year and has been mostly range bound so far this year. In comparison, IEO is down only ~15% over the last year which can be seen in this comparison chart.
For any questions on these commodities or other concepts, please call or email us at 1-877-668-1332 or siateam@siacharts.com.
Click on Image to Enlarge
SIACharts.com specifically represents that it does not give investment advice or advocate the purchase or sale of any security or investment. None of the information contained in this website or document constitutes an offer to sell or the solicitation of an offer to buy any security or other investment or an offer to provide investment services of any kind. Neither SIACharts.com (FundCharts Inc.) nor its third party content providers shall be liable for any errors, inaccuracies or delays in content, or for any actions taken in reliance thereon.


