by Tiho Brkan, Short Side of Long
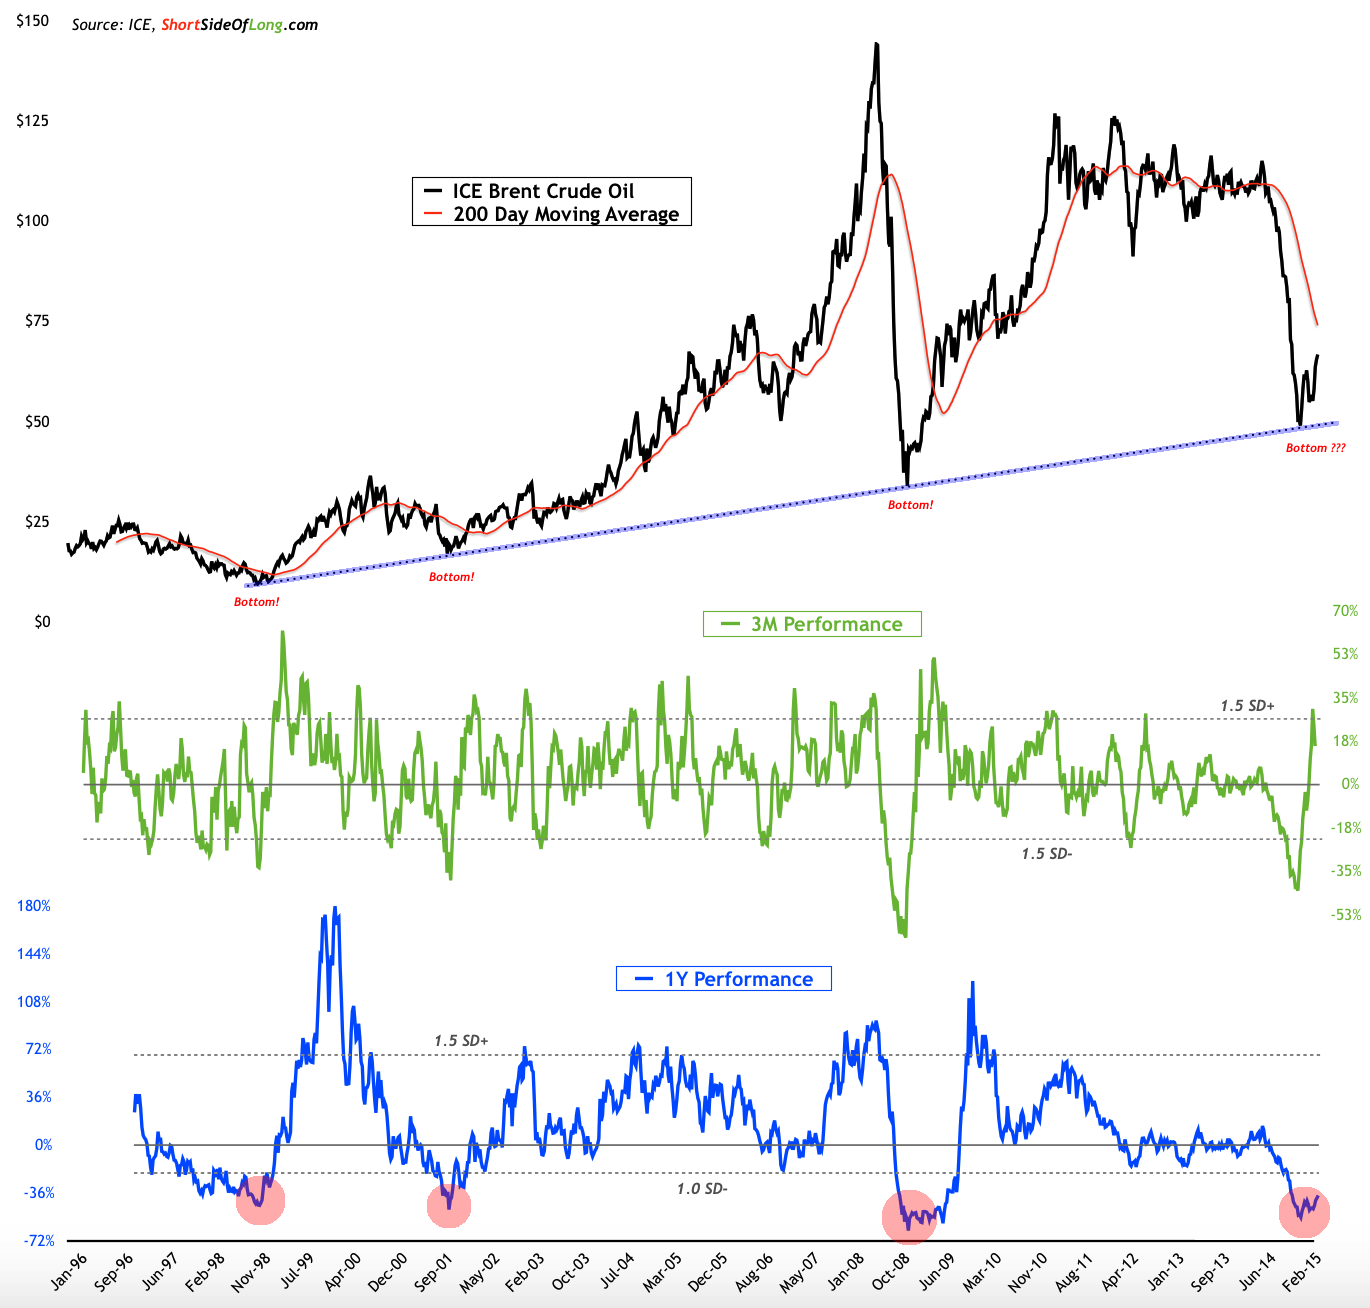
Today's chart of the day focuses on the long term price and performance of Crude Oil. The crash that started in June of 2014 finally turned into a crescendo in January of this year. Crude Oil has most likely found a bottom on a long term support line, as it became incredibly oversold.
However, the question now is what will the recovery look like? Most market experts are on record saying that $100 per barrel will not be seen again. What do you guys think? V shaped recovery, U shaped recovery or an L shaped bear market?
Chart Of The Day: Brent Crude Oil price has most likely bottomed out!
Source: Short Side of Long
Copyright © Short Side of Long


