In a research note late last year, AQR’s Cliff Asness described what long-term means when it comes to the markets (emphasis mine):
Basically, we know a lot more about volatility than the level of returns over the short term (and remember five years is still pretty short-term). I think we all know this already, and it’s implied by basic mathematics, but it helps to be reminded of its importance occasionally.
All in all, this full 45-year period is our most reasonable looking realized efficient frontier yet. So what lessons do we take away from the above, and also from living a fair amount of these 45 years “real time”?
- Five years is not a very long time. You see crazy things over five years. Of course, it often feels like a lifetime to actually live through it.
- Over the long haul (which I’ll call 45 years here though there is no perfect agreed upon definition) some of the most basic parts of financial theory look pretty darn good.
- The long haul is a really long time. It sometimes feels like several lifetimes to actually live through it.
No one considers five years to be short-term in the world of finance, but in terms of risk management it’s a good starting point for setting expectations. And I agree with Asness that volatility is far more predictable than performance over the short-term, but it can be difficult to think this way.
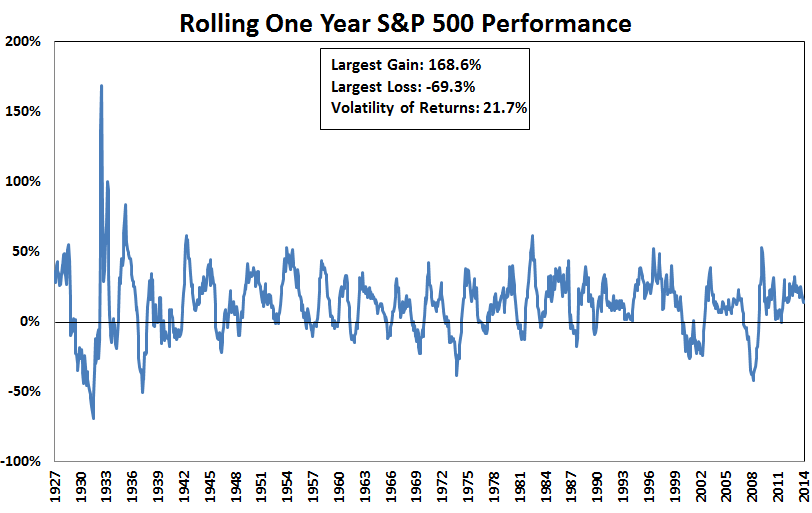
Some concepts are better explained visually, so I put together annual return graphs using rolling monthly returns on the S&P 500 starting in 1927 broken out by different time horizons.
These are the one year numbers where roughly three out of every four years have shown positive returns, but they have been all over the map:
Three year annual returns have been positive in 83% of all rolling windows, but still in a fairly wide range:

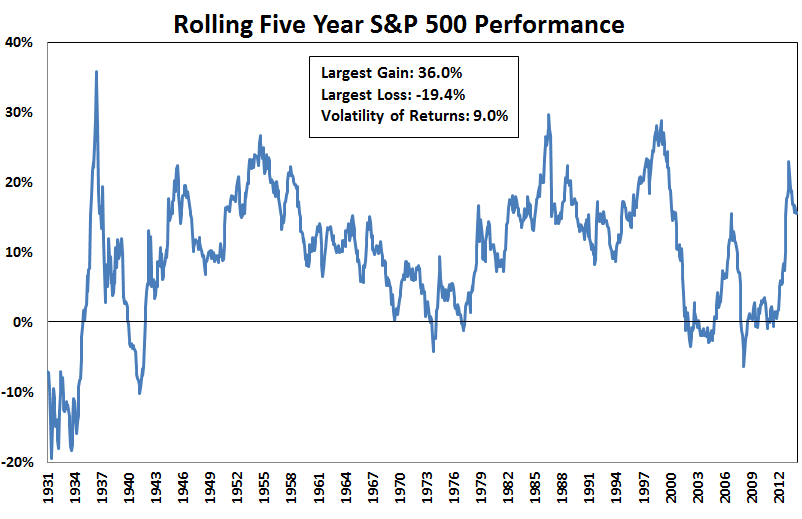
Once you hit five years, what Asness still considers pretty short-term, almost 88% off all annual returns have been positive, but again, the numbers have varied greatly over time:
Go out to ten years and the only two periods with annual losses were experienced in the aftermath of the Great Depression and the Great Recession with 94% of all periods in the black:

There’s never been a negative return over a 20 year time frame, but roughly one-third of all rolling 20 year periods were below the long-term average market return:

Once you get to 30 years the volatility of the average returns is only a fraction of the volatility seen in one year returns. Although they’re in a much tighter band, there’s still some variation over time depending on the start and end points:

It’s worth mentioning that none of these long-term results take into account taxes, fees, commissions or inflation. They also don’t account for the cost of poor behavior which is mostly caused by the very first graph of one year returns.
Some investors mistakening believe that by holding stocks for the
“long run” they will be guaranteed a certain return on their investment. This is not true. Investors aren’t promised 8-10% annual returns just because they increase their holding period. Stocks are risky because even over longer holding periods there’s variation in the results. But history shows that you increase your probability for success by extending your holding period by decreasing your odds of experiencing loss.
Long-term means different things to different investors depending on their circumstances. It’s not realistic to assume all of your capital is going to be able to be set aside in thirty year chunks. I like to start by defining what short-term means and using that as a the baseline to be able to figure out what constitutes the long-term. Only when you’re comfortable enough to be able to handle the short-term you can figure out how to utilize the long-term to your advantage.
Source:
Efficient Frontier “Theory” for the Long Run (AQR)
Further Reading:
The Long Run Revisited
Subscribe to receive email updates and my monthly newsletter by clicking here.
Follow me on Twitter: @awealthofcs