
In this weeks edition of the SIA Equity Leaders Weekly, we will be revisiting two charts we last annotated in early January: Crude Oil and Gold Bullion. When we looked at these charts, Crude had moved down over $40 from its uptrend line breach and Gold had found support, but remained vulnerable from its own uptrend line breakdown. The update on these two important commodities is timely as the Fed came out yesterday on its stance on interest rates, something that has a strong effect on the U.S. Dollar, which by default can influence these two commodities.
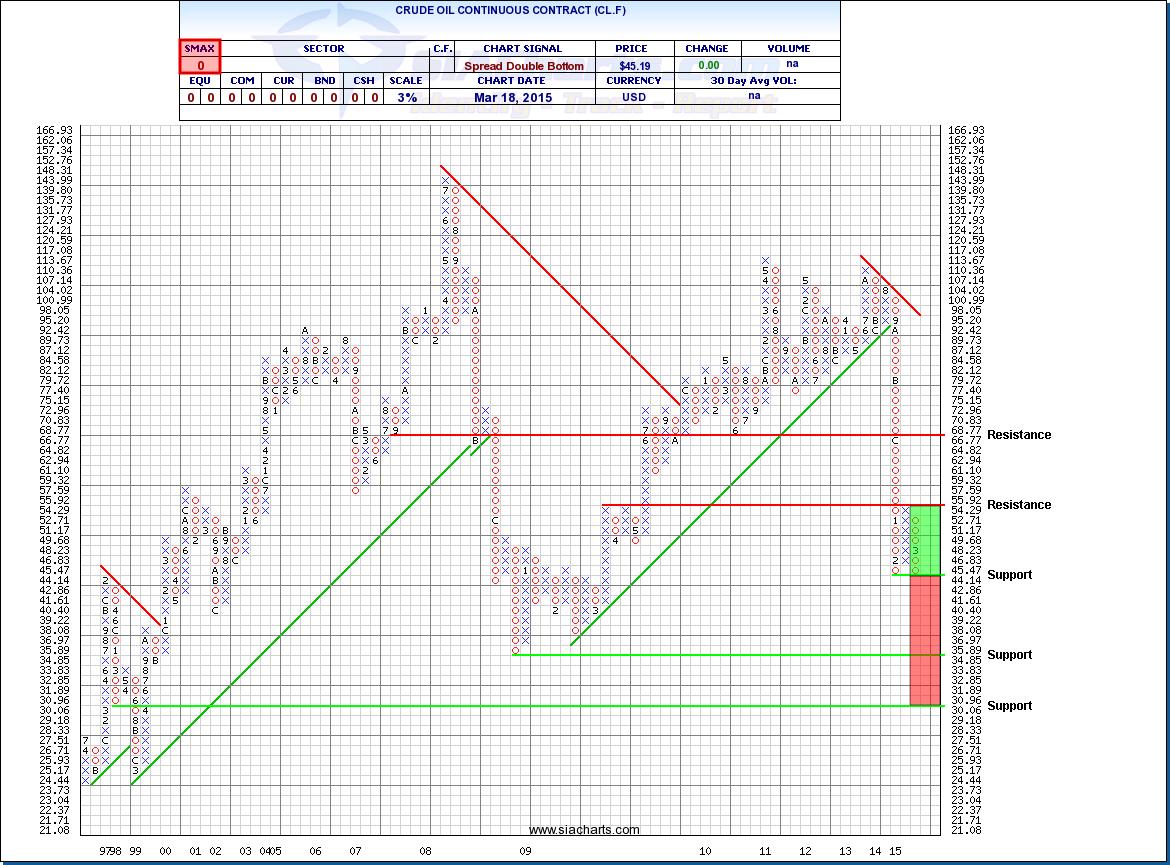
Crude Oil Continuous Contract (CL.F)
The first chart we will look at today is Crude Oil at a longer term outlook at a 3% scale. In January, we were looking at a chart that had, at that point, fallen non-stop from over $100 to below $54 without even one reversal into a column of X's. That fall though was not over with an additional $9 left to go to the downside with support found above $44.14 in early February, a level which still holds today. From here a reversal into X's saw resistance found below $55.92 before falling back down to the current support again.
The chart clearly showed the influence the Fed's call on interest rate hikes would have. A move to raise rates, increasing the value of the dollar, could see support breached on Crude and a potential move down to the $34.85 range. With yesterday's call by the Fed to remove the potential for a near-term hike in rates, the market responded by adding $2 to the price of Crude. This near-term response by investors to bid up Crude certainly offers bullish investors in the commodity a reprieve, but looking at the chart, it still has its work cut out for it with a move above $55.92 necessary to achieve a potential bullish signal on its chart.
Click on Image to Enlarge
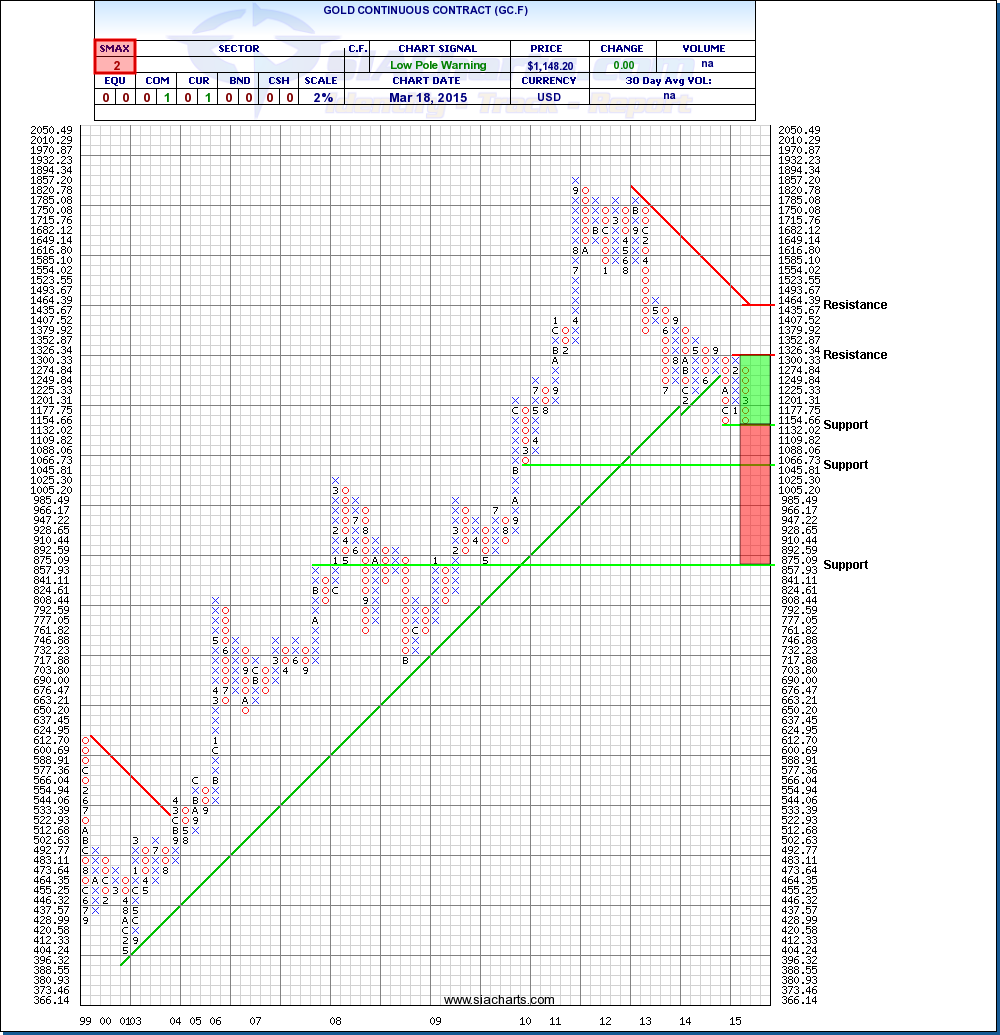
Gold Continuous Contract (GC.F)
Gold, as it turns out, had a very similar pattern to Crude before the Fed announcement yesterday. We can see on the chart that after finding support above $1,132.02, Gold subsequently rallied to resistance below $1,326.34 before retracing back to support. Again, we can anticipate that a call by the Fed to raise interest rates would have seen a subsequent breach of support and potential room to move down to the $875 range. Instead, we saw a bounce off lows by $20 as the Fed reduced fears of a rate hike near-term. As we saw in Crude, it will take more than this short-term bounce to move Gold above a material resistance level. The chart shows us a close above $1,326.34 is needed to accomplish the first column of X's above the previous one since September of 2011.
In both of the charts we looked at today, we can see that the move by the Fed to hold off on raising rates fended off significant breakdowns in Crude and Gold. Although this is likely to see some bullish commentary coming from the camps of these two commodities, there is not much to cheer about from the long-term perspective currently. Both charts continue to show us negative trends and strong risk of significant breakdowns. For those looking for investments, rather than short-term trades, both remain in the no fly zone for now.
Click on Image to Enlarge
SIACharts.com specifically represents that it does not give investment advice or advocate the purchase or sale of any security or investment. None of the information contained in this website or document constitutes an offer to sell or the solicitation of an offer to buy any security or other investment or an offer to provide investment services of any kind. Neither SIACharts.com (FundCharts Inc.) nor its third party content providers shall be liable for any errors, inaccuracies or delays in content, or for any actions taken in reliance thereon.
Any questions or to learn more about these relationships, other Commodities, or other information, please call or email us at 1-877-668-1332 or siateam@siacharts.com.
Copyright © SIACharts.com