by Don Vialoux, EquityClock.com
Pre-opening Comments for Thursday December 11th
U.S. equity index futures were higher this morning. S&P 500 futures were up 8 points in pre-opening trade.
Index futures moved higher following release of economic news at 8:30 AM EST. Consensus for Weekly Jobless Claims was 295,000 versus 297,000 last week. Actual was 299,000. Consensus for November Retail Sales was a gain of 0.4% versus an upwardly revised 0.5% in October. Actual was an increase of 0.7%. Excluding auto sales, consensus was an increase of 0.2% versus 0.3% in October. Actual was a gain of 0.5%. Economists are expected to raise their fourth quarter real GDP estimates following release of this report.
Eli Lilly added $0.87 to $71.92 after Morgan Stanley upgraded the stock to Overweight from Underweight.
Staples added $1.60 to $16.41 after activist investor, Starboard took a stake
Toll Brothers dropped $0.46 to$31.60 after RBC Capital downgraded the stock to Under Perform from Sector Perform. Target was reduced to $30 from $36.
Travelers slipped $0.69 to $103.57 after UBS downgraded the stock to Neutral from Buy. Target is $105.
EquityClock’s Daily Market Comment
Following is a link:
http://www.equityclock.com/2014/12/10/stock-market-outlook-for-december-11-2014/
Note study on crude oil.
Mark Leibovit’s VR Trader comments on DIA
Following is a link:
Interesting Charts
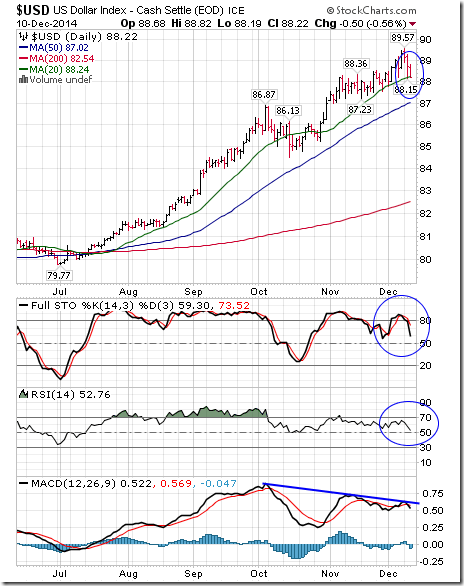
Short term technicals show that the U.S. Dollar Index probably reached a short term peak at 89.57:
· Stochastics, RSI and MACD have just turned lower from short term overbought levels
· The Index closed below its 20 day moving average
Additional short term weakness will have a positive technical impact on precious metals and precious metal stocks.
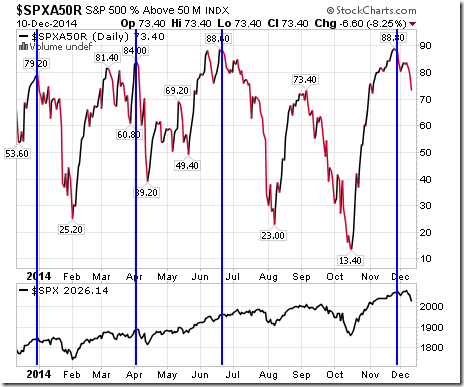
Percent of S&P 500 stocks trading above their 50 day moving average peaked on November 25th and is trending down.
StockTwits released yesterday @equityclock
Technical action by S&P 500 stocks to 10:30: Quiet. Breakouts: $D, $DUK. Breakdown: $CVX
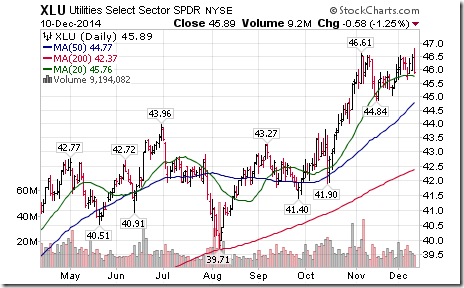
Notable strength this morning came in the utilities sector. $XLU broke resistance to reach an all-time high.
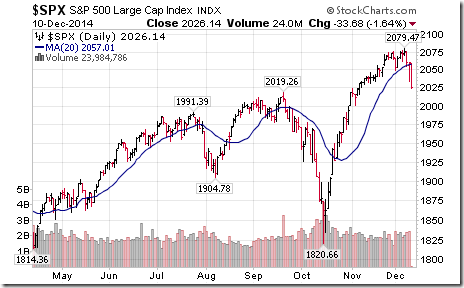
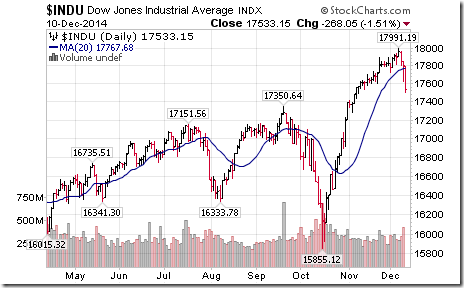
S&P 500 Index and Dow Jones Industrial Average dropped below their 20 day moving average this morning. Not a good sign!
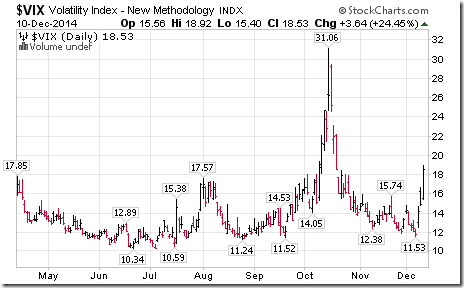
The VIX Index is spiking with downside pressure on U.S. markets
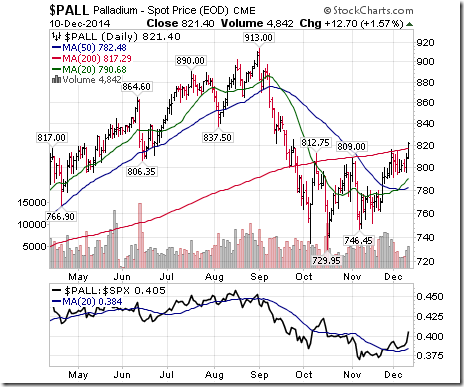
Encouraging technicals for precious metals! Nice short term breakout by $PALL!
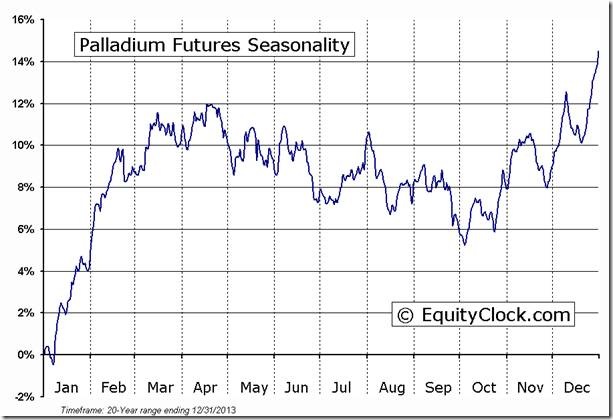
‘Tis the season for strength in Palladium!
Technical Action by Individual Equities Yesterday
After 10:30 AM EST, eight S&P 500 stocks broke support: Discover Financial (DFS), Borg Warner (BWA), Ryder (R), Norfolk Southern (NSC), Rockwell Automation (ROK), Cognizant Tech (CTSH), Dow Chemical (DOW), Pepco Holdings (POM)
Among TSX 60 stocks, Canadian Pacific broke support.
Trader’s Corner
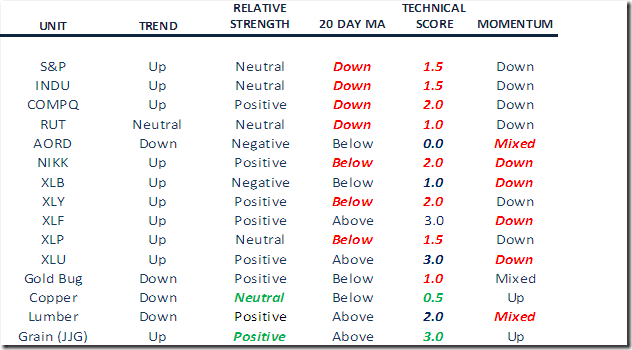
Changes in technical parameters for equity indices, sectors and commodities yesterday
Monitored List of Technical/Seasonal Ideas
Green: Increased score
Red: Decreased score
A score of 1.5 or higher is needed to maintain a position
CHRW was removed from the list at the close yesterday with a profit of 4.1% after technical score fell below 1.5
Special Free Services available through www.equityclock.com
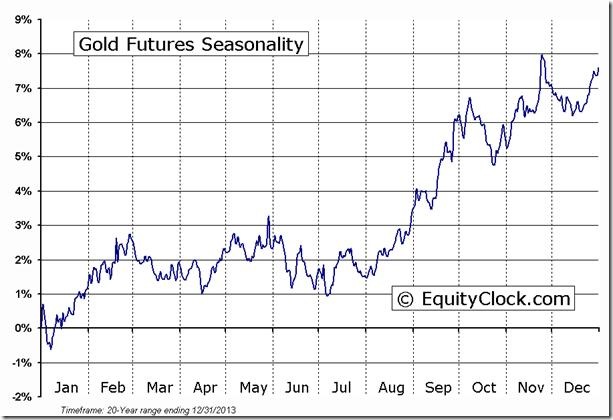
Equityclock.com is offering free access to a data base showing seasonal studies on individual stocks and sectors. The data base holds seasonality studies on over 1000 big and moderate cap securities and indices. To login, simply go to http://www.equityclock.com/charts/
Following is an example:
====================================================================
INVESTMENT COMMENTARY
Thursday, December 11, 2014
If you like to receive our bi-monthly newsletter or know more about our model portfolios and investment philosophy and what areas we are invested in now for clients please complete the form at: http://www.castlemoore.com/investorcentre/signup.php.
PLEASE CHECK OUT HAP SNEDDON’S APPEARANCE ON BNN’S THE CLOSE YESTERDAY WHEREIN HE’S CALLED IN TO ANALYSE THE LATEST MARKET ACTION bit.ly/1un7edW
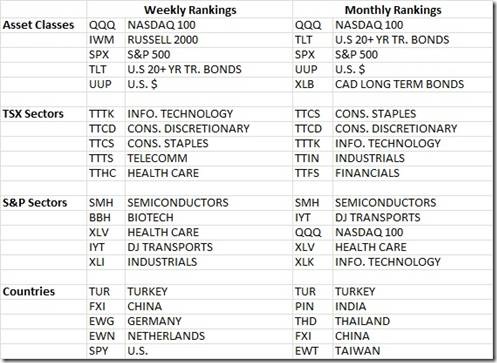
TOP ASSET 5 CLASSES, SECTORS AND COUNTRY HEAT MAPPING
Commentary:
The asset class, sector and country index heat mapping tables are fairly consistent week-over- week. Since we did not report in these pages last week when the monthly data was anew it is worth noting that the TSX index fell out of the top 5 in the asset class monthly (right column) rankings and was replaced by Canadian long term bonds (government and corps). There was no change in the top 5 for the weekly (left column) rankings, just the ordering of the top 5. Again, Canadian long bonds are strong in the weeklies at number 6, just outside of what we show above. The overall message is that bonds are strong, commodities weak and markets with little resource exposure investible until further notice. In the Canadian and US equity sectors a pro-defensive posture is still evident, though in the TSX weekly rankings utilities fell to 6th (not shown). It interesting to observe that the US transports remain strong with the fall in oil, and it begets questions about home much energy weakness is about demand. A demand issue would affect this space eventually, cheap energy aside. We’ll comment on this later as things develop. In the country rankings show consistency in the push by Turkey, China, and India. Near term volatility in any, such as India, should push them down the weekly rankings but keep them high on the monthlies, a “buy the dip” mentality.
CHARTS of the WEEK
Bond Yields
Until further notice, until the trend changes, investors who allocate capital to strong asset classes should own government bonds. At present core portfolios hold 30% AAA government long dated bonds.
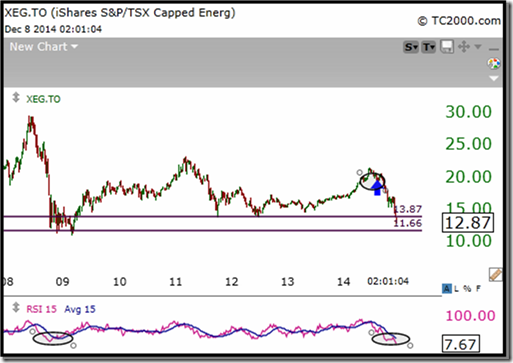
TSX Energy ETF
Energy stocks, reflected here through the iShares energy ETF, are weak having broken key support recently on both a weekly and monthly basis. CastleMoore sold all its energy holdings in June and July (arrow) on supply concerns. Recent action has been about demand concerns. In the spring of 2012 a 30% drop of WTI led to a 12% correction in the TSX. The difference in the analogies is that demand now is expected to be at 2004 levels.
Chinese Equities – Shanghai Index
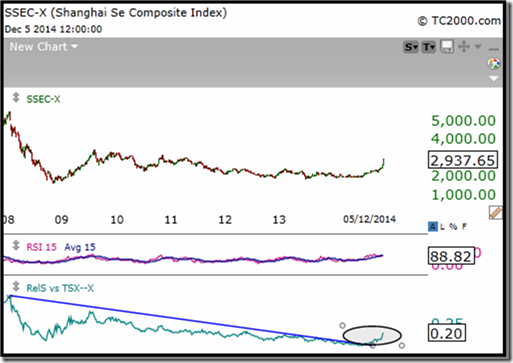
Not all markets are correlated. A quick look at Chinese equities shows a market down 53% since its 2008 highs. In the last six months the market is becoming a strong relative investment compared to the TSX (and the S&P). Though lower oil prices are positive for an export economy like China (inputs) it does suggest lower overall global demand. Lower global growth potential is offset by demand from a growing middle class.
Gold – Producers vs Bullion
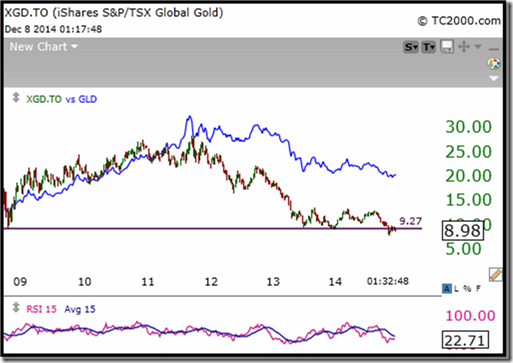
Gold producers (and gold) are finding support at these levels offering excellent risk to reward. A short-term move is underway. A sustained move above the $11.60-$11.75 area in XGD.to ushers in an intermediate buy signal with a first target at $15.00, then $17.00.
Fortis Inc.
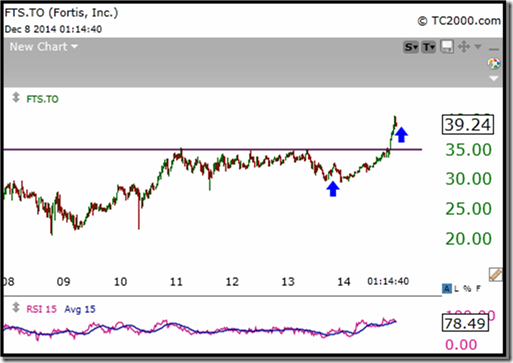
We recently sold half our position in Fortis having made 32% in a short time frame. We still see potential in the stock going forward – we simply wanted to book the profit near term and look to buy that which we sold at lower levels. After the sale, portfolios still hold 9% in the utility sector across Canada and the US. The sector has some nice tailwinds, despite the chatter about inflation and higher interest rates.
If you like to receive bi-monthly newsletter, know more about our model portfolios or access an audio file of our investment philosophy, “Modern Financial Fiascos”, click on the link
http://www.castlemoore.com/investorcentre/signup.php
CastleMoore Inc. uses a proprietary Risk/Reward Matrix that places clients with minimum portfolios of $500,000 within one of 12 discretionary portfolios based on risk tolerance, investment objectives, income, net worth and investing experience. For more information on our methodology please contact us.
Buy, Hold…and Know When to Sell
This commentary is not to be considered as offering investment advice on any particular security or market. Please consult a professional or if you invest on your own do your homework and get a good plan, before risking any of your hard earned money. The information provided in CastleMoore Investment Commentary or News, a publication for clients and friends of CastleMoore Inc., is intended to provide a broad look at investing wisdom, and in particular, investment methodologies or techniques. We avoid recommending specific securities due to the inherent risk any one security poses to ones’ overall investment success. Our advice to our clients is based on their risk tolerance, investment objectives, previous market experience, net worth and current income. Please contact CastleMoore Inc. if you require further clarification on this disclaimer.
====================================================================
Disclaimer: Comments, charts and opinions offered in this report by www.timingthemarket.ca and www.equityclock.com are for information only. They should not be considered as advice to purchase or to sell mentioned securities. Data offered in this report is believed to be accurate, but is not guaranteed. Don and Jon Vialoux are Research Analysts with Horizons ETFs Management (Canada) Inc. All of the views expressed herein are the personal views of the authors and are not necessarily the views of Horizons ETFs Management (Canada) Inc., although any of the recommendations found herein may be reflected in positions or transactions in the various client portfolios managed by Horizons ETFs Management (Canada) Inc.
Individual equities mentioned in StockTwits are not held personally or in HAC.
Horizons Seasonal Rotation ETF HAC December 10th 2014



![clip_image002[5] clip_image002[5]](https://advisoranalyst.com/wp-content/uploads/HLIC/960cd370704b3f69ee20d4d3be0fe9b7.png)
![clip_image006[5] clip_image006[5]](https://advisoranalyst.com/wp-content/uploads/HLIC/b7fe286a2854b388547913f799e5eee0.png)

![clip_image002[7] clip_image002[7]](https://advisoranalyst.com/wp-content/uploads/HLIC/f274002e4e691118374ff6e7b19e5135.png)


