by Don Vialoux, EquityClock.com
Pre-opening Comments for Monday November 10th
U.S. equity index futures were higher this morning. S&P 500 futures were up 3 points in pre-opening trade. Index futures responded to encouraging economic news from China. The Shanghai Composite Index added 2.31% last night.
The Canadian Dollar was virtually unchanged following release of less than expected Canadian October Housing Starts.
Third quarter earnings reports continue to pour in. Companies that reported this morning include Toll Brothers, TransOcean and Dean Foods.
American Eagle Outfitters slipped $0.24 to $12.70 after Barclays and B. Riley downgraded the stock.
General Mills (GIS $51.36) is expected to open lower after RBC Capital downgraded the stock from Outperform to Sector perform. Target is $54.
Target gained $0.50 to $64.67 after Stifel Nicolaus upgraded the stock from Hold to Buy. Target is $76.
EquityClock.com’s Daily Market Comment
Following is a link:
http://www.equityclock.com/2014/11/09/stock-market-outlook-for-november-10-2014/
Economic News This Week
Canadian October Housing Starts to be released at 8:15 AM EST on Monday are expected to increase to 200,000 from 197,300 in September
Weekly Jobless Claims to be released at 8:30 AM EST on Thursday are expected to increase to 281,000 from 278,000 last week.
October Retail Sales to be released at 8:30 AM EST on Friday are expected to increase 0.3% versus a decline of 0.3% in September. Excluding auto sales, October Retail Sales are expected to increase 0.3% versus a decline of 0.2% in September.
November Michigan Sentiment Index to be released at 9:55 AM EST on Friday is expected to increase to 87.5 from 86.9 in October
September Business Inventories to be released at 10:00 AM EST on Friday are expected to increase 0.2% versus a gain of 0.2% in August.
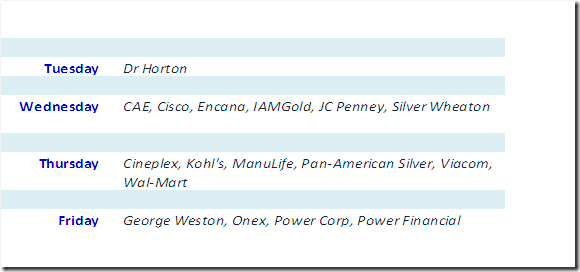
Earnings News This Week
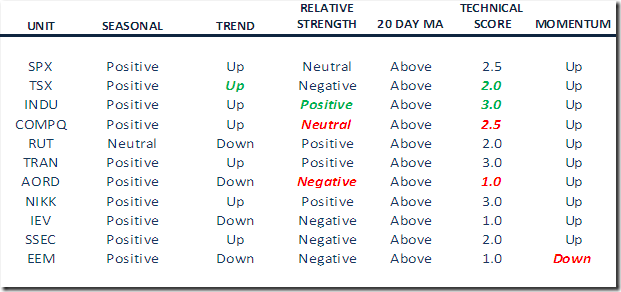
Summary of Weekly Seasonal/Technical Parameters for Equity Indices/ETFs
Seasonal: Positive, Negative or Neutral on a relative basis applying EquityClock.com charts
Trend: Up, Down or Neutral
Strength relative to the S&P 500 Index: Positive, Negative or Neutral
Momentum based on an average of Stochastics, RSI and MACD: Up, Down or Mixed
Green: Upgrade
Red: Downgrade
Equity Trends
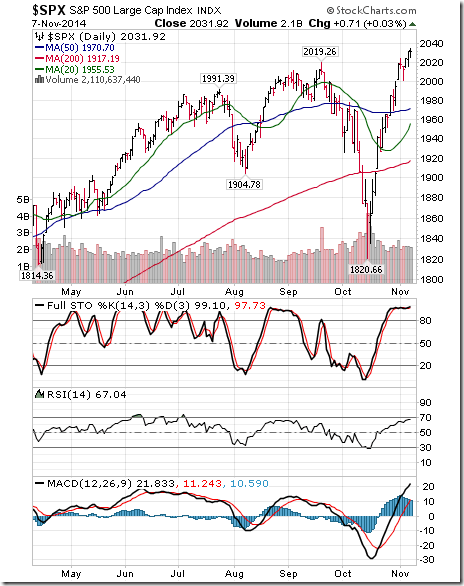
The S&P 500 Index added 13.87 points (0.69%) last week. Intermediate trend remains up. The Index remains above its 20, 50 and 200 day moving averages. Short term momentum indicators are trending higher, but are overbought.
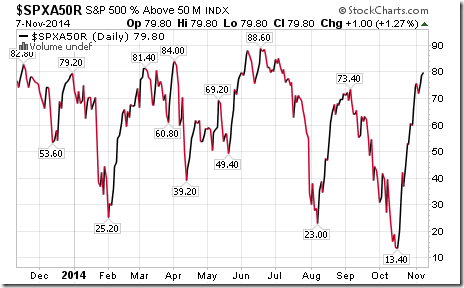
Percent of S&P 500 stocks trading above their 50 day moving average increase last week to79.80% from 74.80%. Percent continues to trend up, but is intermediate overbought.
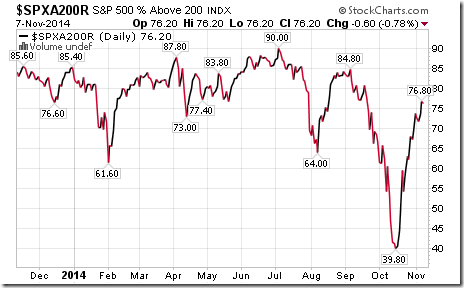
Percent of S&P 500 stocks trading above their 200 day moving average increased last week to 76.20% from 73.80%. Percent continues to trend up, but is intermediate overbought.
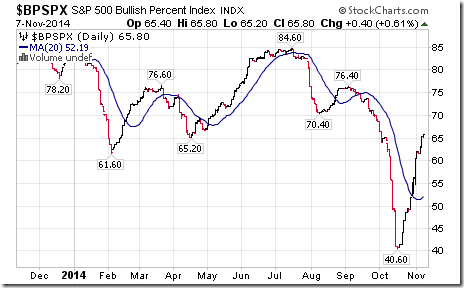
Bullish Percent Index for S&P 500 stocks increased last week to 65.80% from 60.40% and remains above its 20 day moving average. The Index is trending up, but is intermediate overbought.
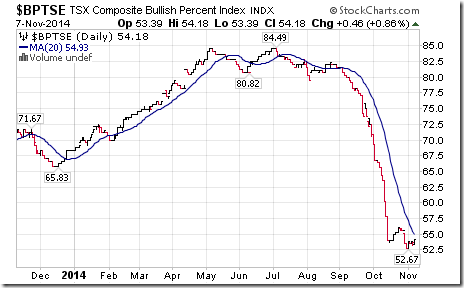
Bullish Percent Index for TSX Composite stocks increased last week to 54.18% from 52.67%, but remained below its 20 day moving average. The Index remains in an intermediate downtrend.
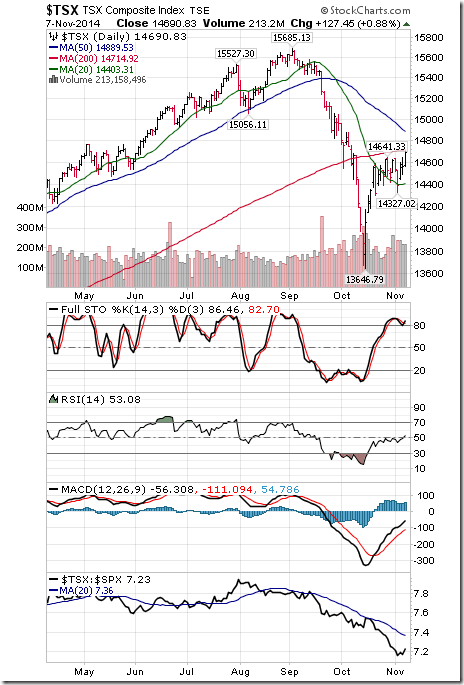
The TSX Composite Index added 77.51 points (0.53%) last week. Intermediate trend changed to up from down on a move above 14,641.33 on Friday (Score: 1.0). The Index remains above its 20 day moving average (Score: 1.0). Strength relative to the S&P 500 Index remain negative (Score: 0.0). Technical score improved to 2.0 from 1.0 out of 3.0. Short term momentum indicators are trending up, but are overbought.
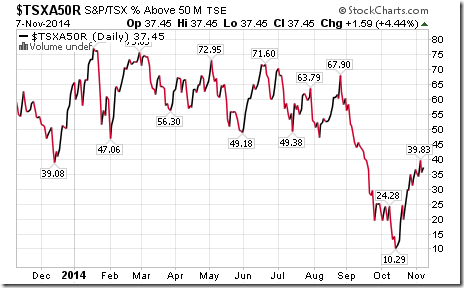
Percent of TSX stocks trading above their 50 day moving average increased last week to 37.45% from 36.63%. Percent remains in an intermediate uptrend.
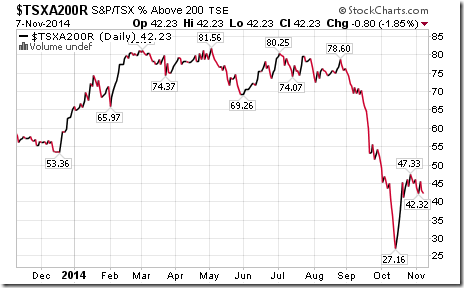
Percent of TSX stocks trading above their 200 day moving average fell last week to 42.23% from 46.09%.
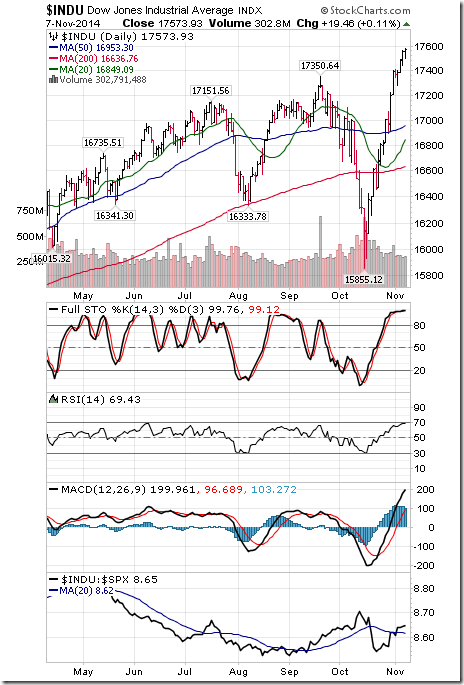
The Dow Jones Industrial Average gained 183.41 points (1.05%) last week. Intermediate trend remains up. The Average remains above its 20 day moving average. Strength relative to the S&P 500 Index changed to positive from neutral. Technical score improved to 3.0 from 2.5. Short term momentum indicators are trending up, but are overbought.
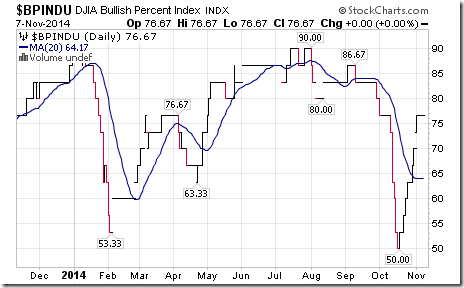
Bullish Percent Index for Dow Jones Industrial Average stocks increased last week to 76.67% from70.00% and remained above its 20 day moving average. The Index remains intermediate overbought.
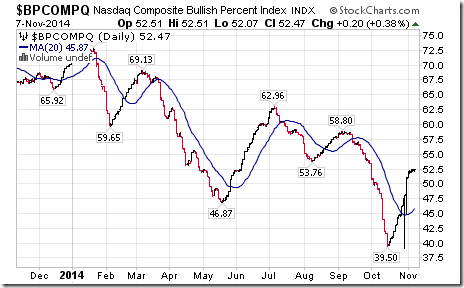
Bullish Percent Index for NASDAQ Composite stocks increased last week to52.47% from 50.98% and remained above its 20 day moving average. The Index continues to trend higher.
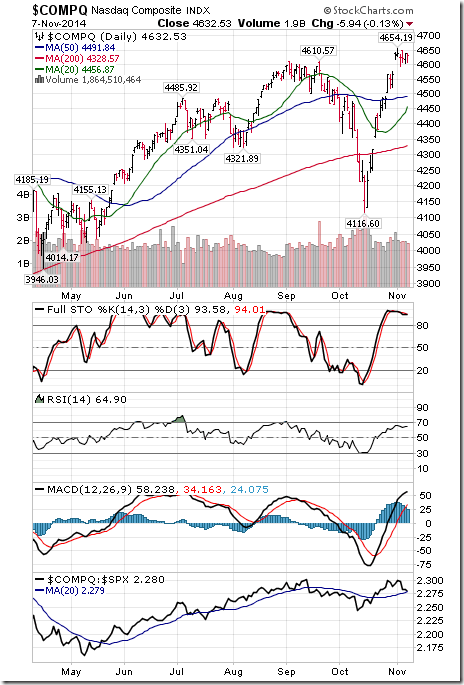
The NASDAQ Composite Index added 1.79 points (0.04%) last week. Intermediate trend remains up. The Index remains above its 20 day moving average. Strength relative to the S&P 500 Index changed to neutral from positive. Technical score slipped to 2.5 from 3.0 out of 3.0. Short term momentum indicators are trending up, but are overbought.
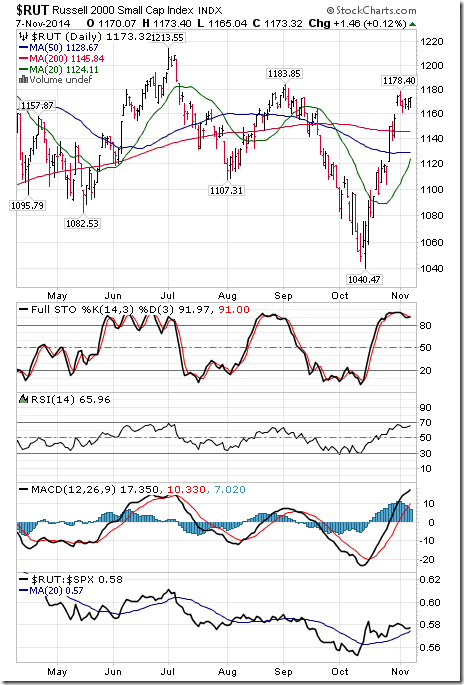
The Russell 2000 Index slipped 0.19 (0.02%) last week. Intermediate trend remains down. The Index remains above its 20 day moving average. Strength relative to the S&P 500 Index remains positive. Technical score remains at 2.0. Short term momentum indicators are trending up, but are overbought.
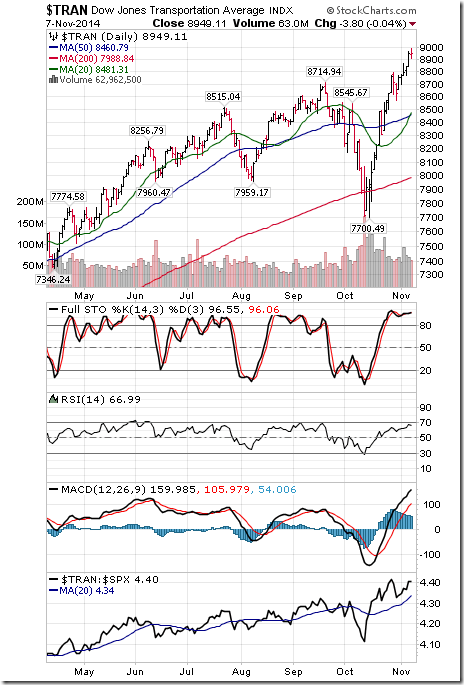
The Dow Jones Transportation Average jumped 193.60 points (2.21%) last week. Intermediate trend remains up. The Average remains above its 20 day moving average. Strength relative to the S&P 500 Index remains positive. Technical score remains at 3.0 out of 3.0. Short term momentum indicators are trending up, but are overbought
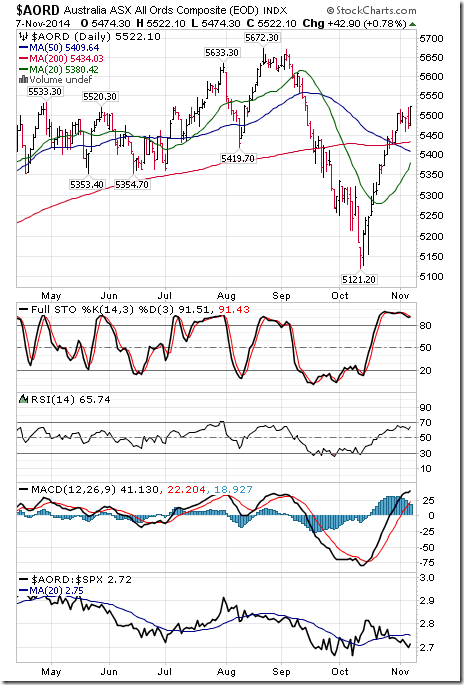
The Australia All Ordinaries Composite Index added 17.10 points (0.31%) last week. Intermediate trend remains down. The Index remains above its 20 day moving average. Strength relative to the S&P 500 Index changed to negative from neutral. Short term momentum indicators are trend up, but are overbought.
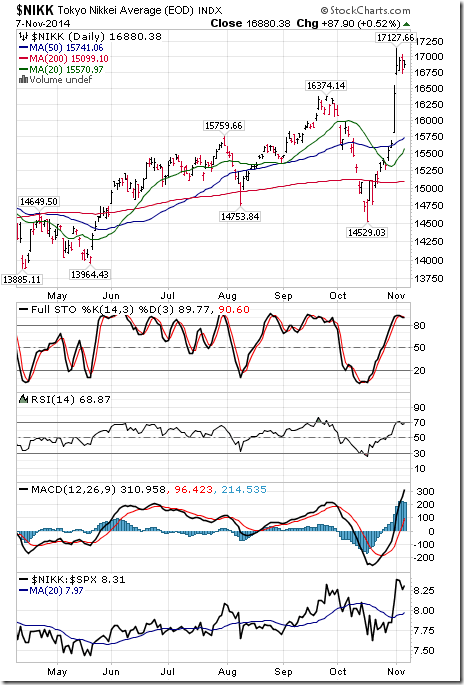
The Nikkei Average gained another 466.62 points (2.84%) last week. Intermediate trend remains up. The Average remains above its 20 day moving average. Strength relative to the S&P 500 Index remains positive. Technical score remains at 3.0 out of 3.0. Short term momentum indicators are trending up, but are overbought.
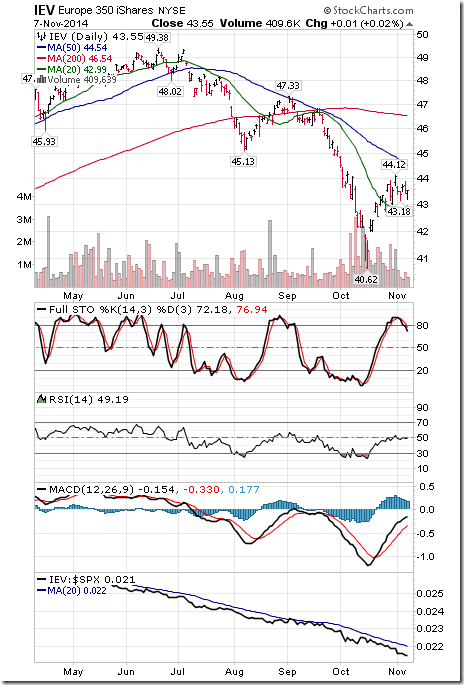
iShares Europe 350 fell $0.54 (1.22%) last week. Intermediate trend remains down. Units remain above their 20 day moving average. Strength relative to the S&P 500 Index remains negative. Technical score remains at 1.0 out of 3.0. Short term momentum indicators are trending up, but are overbought and showing early signs of rolling over.
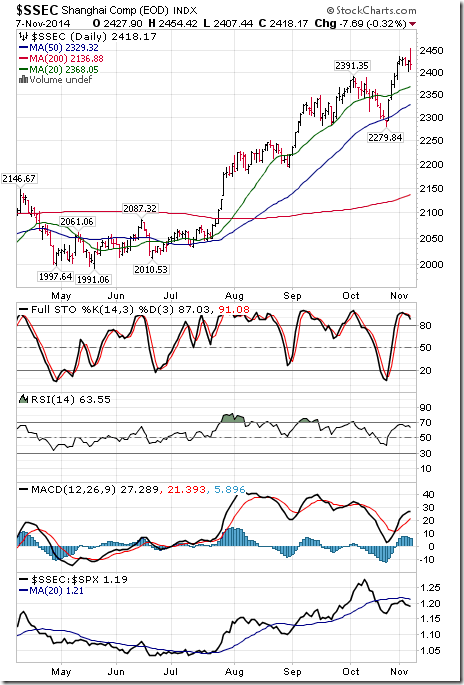
The Shanghai Composite Index slipped 2.01 points (0.08%) last week. Intermediate trend remains up. The Index remains above its 20 day moving average. Strength relative to the S&P 500 Index remains negative. Technical score remains at 2.0 out of 3.0. Short term momentum indicators are trending up, but are overbought and showing early signs of rolling over.
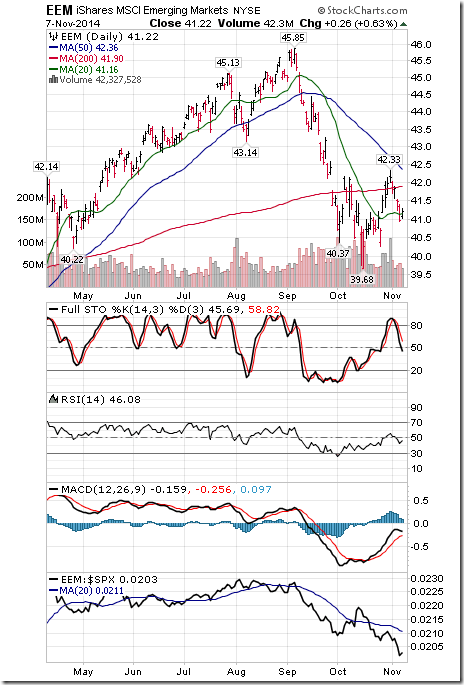
iShares Emerging Markets fell $0.93 (2.21%) last week. Intermediate trend remains down. Units remain above their 20 day moving average. Strength relative to the S&P 500 Index remains negative. Technical score remains at 1.0 out of 3.0. Short term momentum indicators have rolled over and are trending down.
Currencies
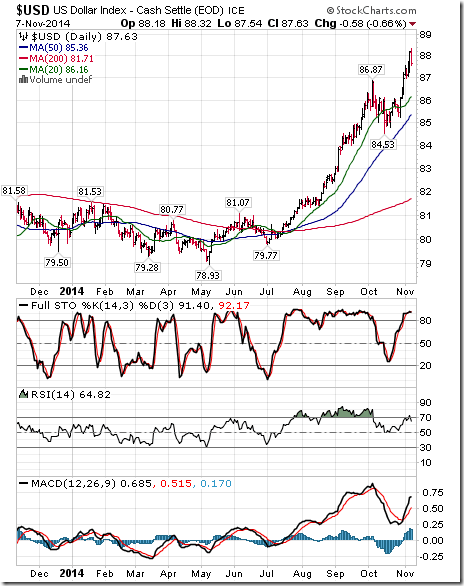
The U.S. Dollar Index gained another 0.66 (0.76%) last week. Intermediate trend remains up. The Index remains above its 20 day moving average. Short term momentum indicators are trending up, but are overbought.
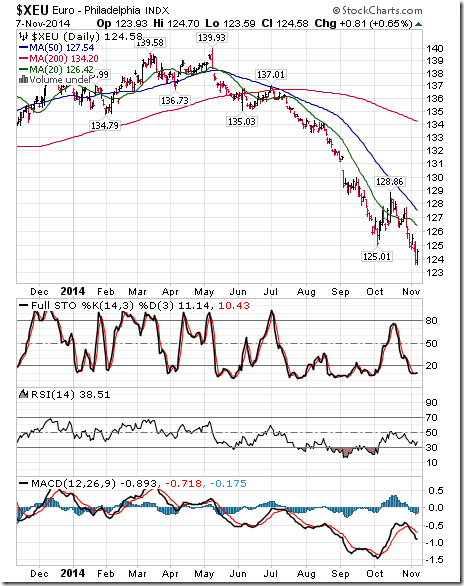
The Euro slipped 0.75 (0.60%) last week. Intermediate trend remains down. Short term momentum indicators are trending down, but are oversold.
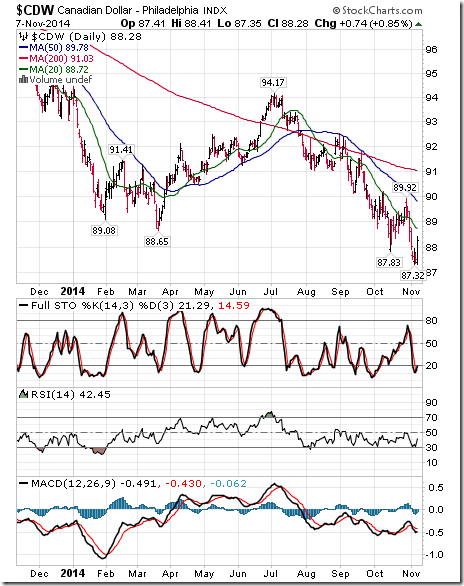
The Canadian Dollar dropped US 0.45 cents (0.51%) last week. Intermediate trend remains down. The Canuck Buck remains below its 20 day moving average. Short term momentum indicators are trending down, but are oversold.
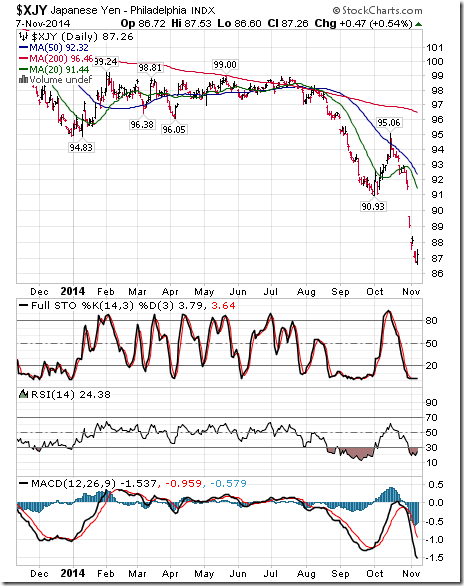
The Japanese Yen dropped another 1.77 (1.99%) last week. Intermediate trend remains down. The Yen remains below its 20 day moving average. Short term momentum indicators are trending down, but are oversold.
Commodities
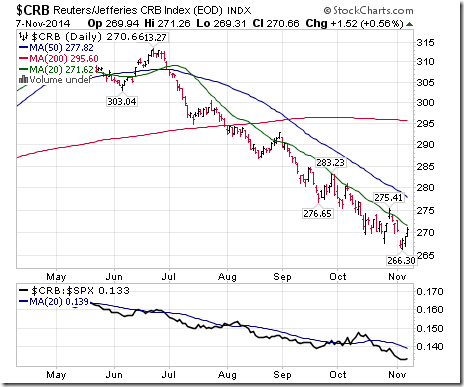
The CRB Index fell 1.30 points (0.58%) last week. Intermediate trend remains down. The Index remains below its 20 day moving average. Strength relative to the S&P 500 Index remains negative. Technical score remains at 0.0 out of 3.0.
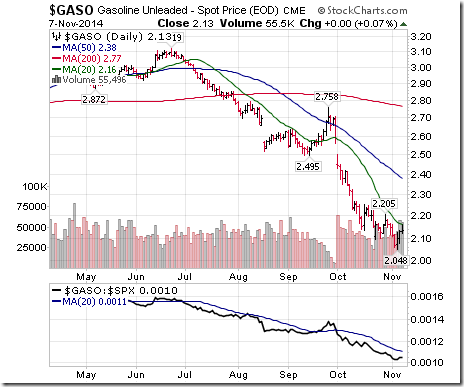
Gasoline fell another $0.02 per gallon. Intermediate trend remains down. Gas remains below its 20 day moving average. Strength relative to the S&P 500 Index remains negative. Technical score remains at 0.0 out of 3.0.
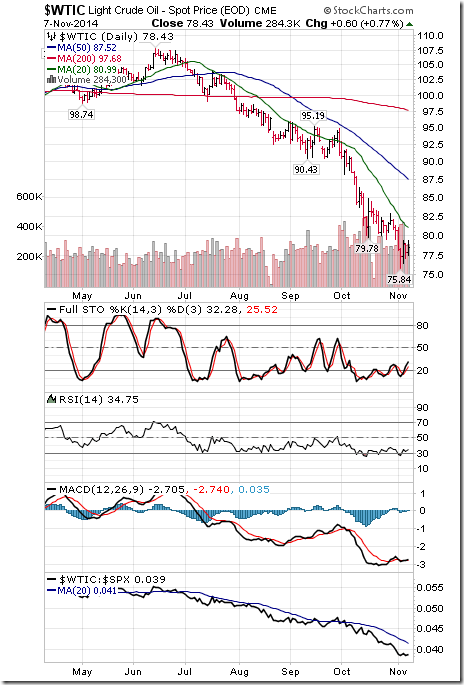
Crude Oil fell another $2.11 per barrel (2.62%) last week. Intermediate trend remains down. Crude remains below its 20 day moving average. Strength relative to the S&P 500 Index remains negative. Short term momentum indicators changed from negative to mixed.
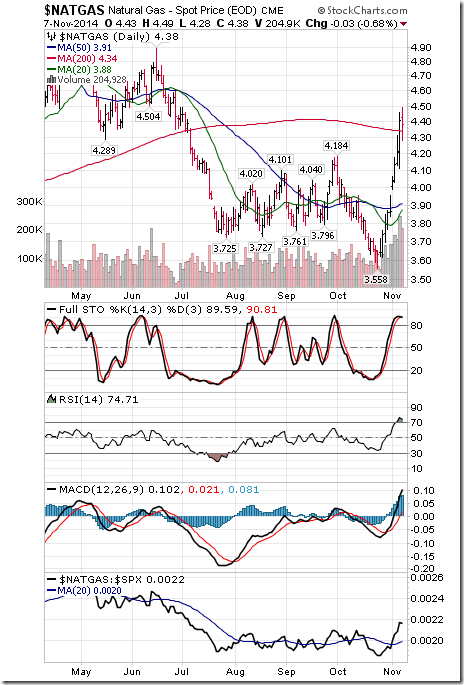
Natural Gas jumped $0.51 per MBtu (13.18%) last week. Intermediate trend changed from down to up on a move above $4.18. “Natty” remained above its 20 day moving average. Strength relative to the S&P 500 Index changed to positive from neutral. Technical score improved to 3.0 from 1.5 out of 3.0. Short term momentum indicators are trending up, but are overbought.
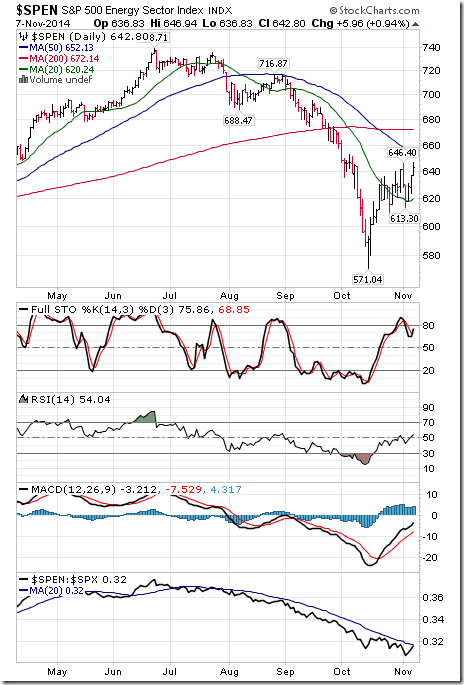
The S&P Energy Index gained 1.48 points (0.23%) last week. Intermediate trend remains down. The Index remains above its 20 day moving average. Strength relative to the S&P 500 Index changed from negative to neutral. Technical score improved to 1.5 from 1.0 out of 3.0. Short term momentum indicators are trending up.
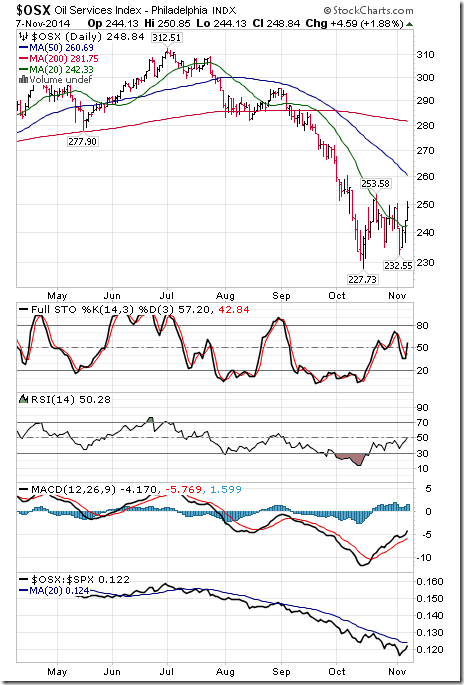
The Philadelphia Oil Services Index added $0.10 (0.04%) last week. Intermediate trend remains down. The Index remained above its 20 day moving average. Strength relative to the S&P 500 Index remains negative. Technical score remains at 1.0 out of 3.0. Short term momentum indicators are trending up.
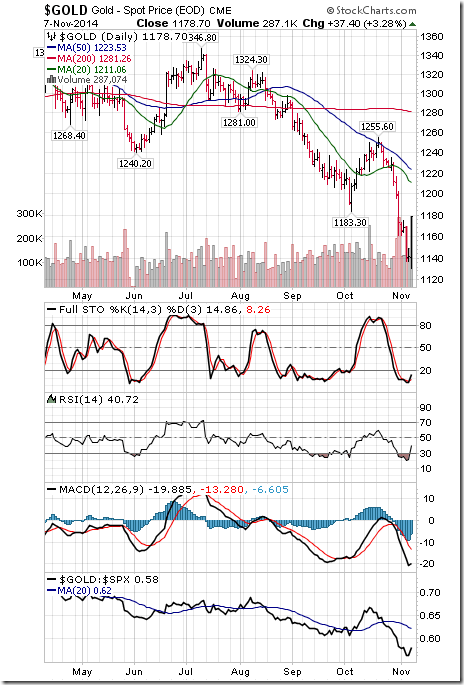
Gold gained $7.10 per ounce (0.61%) last week. Intermediate trend remains up. Gold remains below its 20 day moving average. Strength relative to the S&P 500 Index remains negative. Technical score remains at 0.0 out of 3.0. Short term momentum indicators are mixed.
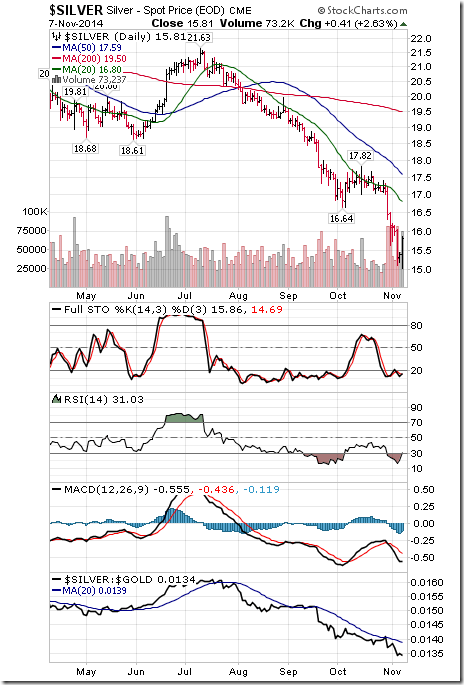
Silver fell $0.030 per ounce (1.86%) last week. Intermediate trend remains down. Silver remains below its 20 day moving average. Strength relative to the S&P 500 Index and Gold remains negative. Technical score remains at 0.0 out of 3.0. Short term momentum indicators have turned mixed from down.
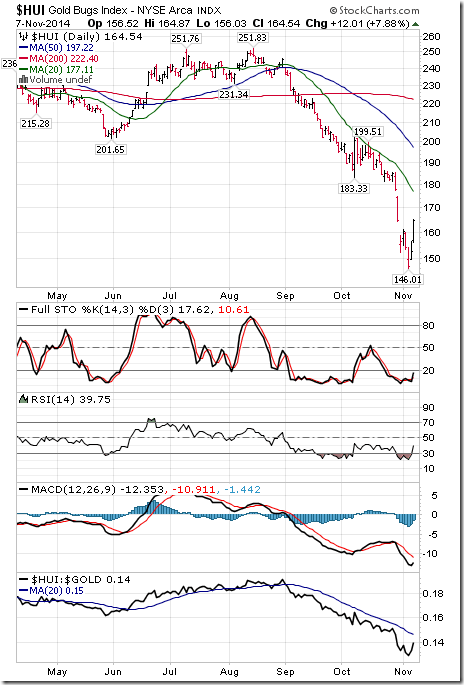
The AMEX Gold Bug Index gained 8.32 points (5.33%) last week. Intermediate trend remains down. The Index remains below its 20 day moving average. Strength relative to the S&P 500 Index and Gold remains negative. Short term momentum indicators have turned from negative to mixed.
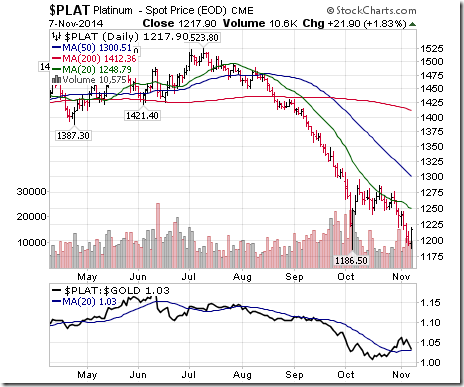
Platinum fell $17.30 per ounce (1.40%) last week. Intermediate trend remains down. PLAT remains below its 20 day moving average. Strength relative to S&P 500 Index remains negative.
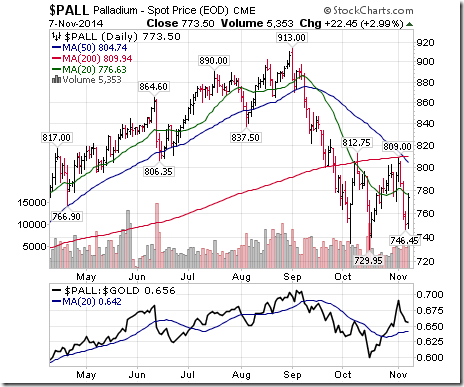
Palladium dropped $18.30 per ounce (2.31%) last week. Intermediate trend remains down. PALL remains below its 20 day moving average. Strength relative to the S&P 500 Index remains negative. Strength relative to Gold remains positive.
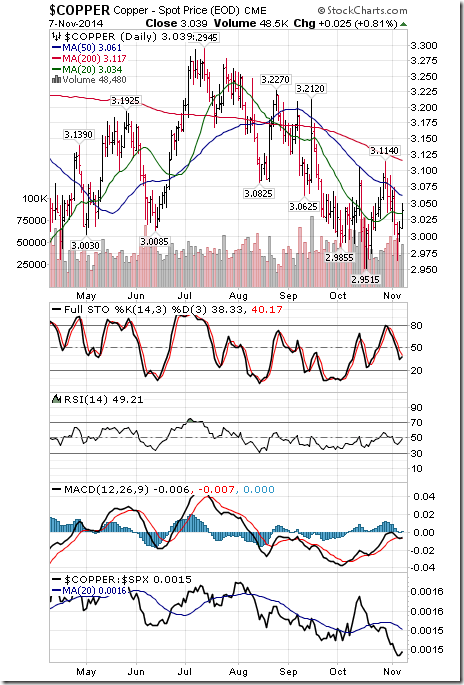
Copper slipped $0.004 cents per lb. (0.26%) last week. Intermediate trend remains down. Copper remains above its 20 day moving average on Friday. Strength relative to the S&P 500 Index remains negative. Technical score remained at 1.0 out of 3.0. Short term momentum indicators are mixed.
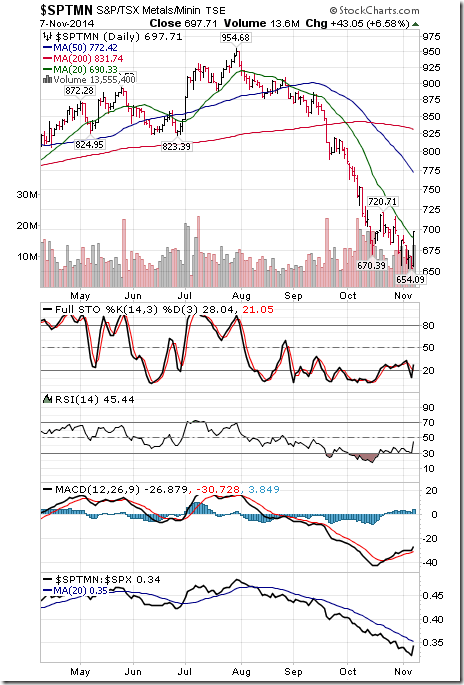
The TSX Metals & Mineral Index added 10.22 points (1.49%) last week. Intermediate trend remains down. The Index moved above its 20 day moving average on Friday. Strength relative to the S&P 500 Index remains negative. Technical score improved to 1.0 from 0.0 out of 3.0. Short term momentum indicators are trending up.
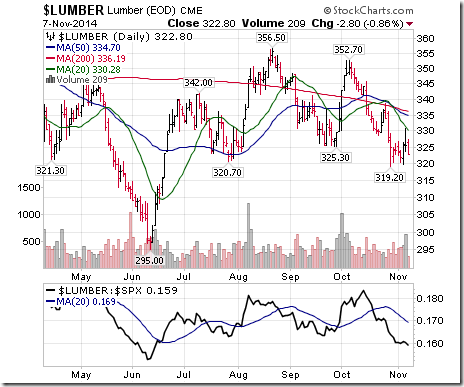
Lumber slipped $1.30 (0.40%) last week. Trend remains down. Lumber remains below its 20 day MA. Strength relative to the S&P 500 Index remains negative. Technical score: 0.0.
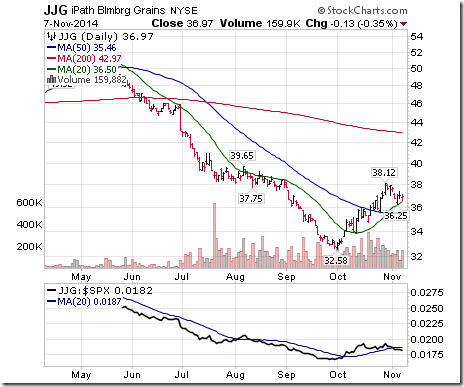
The Grain ETN fell $0.93 (2.45%) last week. Trend remains down. Units remain above their 20 day moving average. Strength relative to the S&P 500 Index changed to neutral from positive. Technical score slipped to 1.5 from 2.0 out of 3.0.
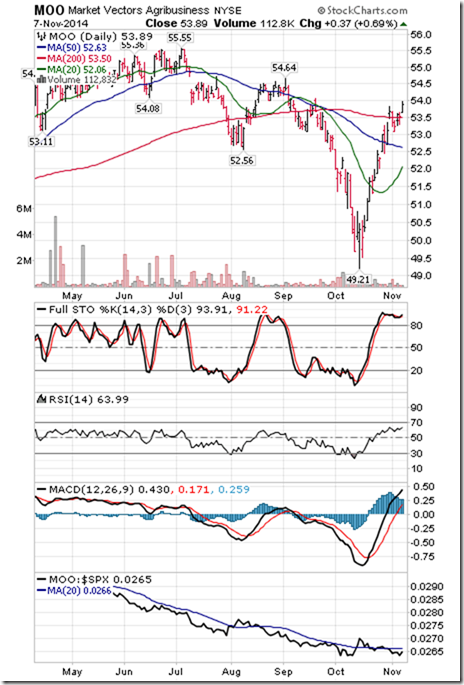
The Agriculture ETF added $0.23 (0.43%) last week. Intermediate trend remains down. Units remain above their 20 day moving average. Strength relative to the S&P 500 Index changed to negative from neutral. Technical score slipped to 1.0 from 1.5 out of 3.0. Short term momentum indicators are trending up, but are overbought.
Interest Rates
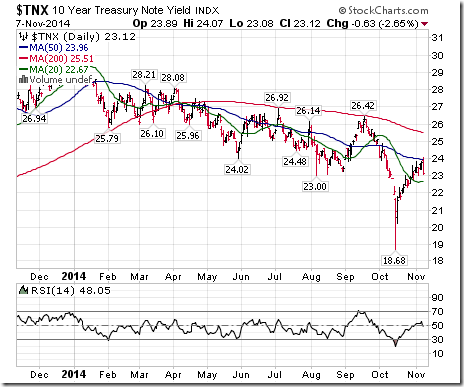
The yield on 10 year treasuries slipped 2.3 basis points (0.99%) last week. Intermediate trend remains down. Yield remains above its 20 day moving average. Short term momentum indicators are trending up, but are overbought.
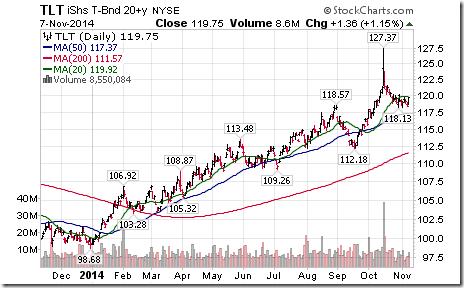
Conversely, price of the long term Treasury ETF added $0.50 (0.42%) last week. Intermediate trend remains up. Price remains below its 20 day moving average.
Other Issues
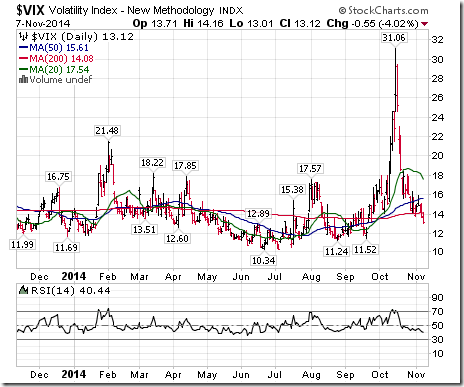
The VIX Index fell another 0.32 (2.28%) last week. Intermediate trend remains up. The Index remains below its 20 day moving average.
Economic news this week is quiet. Focus is on October Retail sales to be released on Friday. Other economic reports are expected to show slow but steady growth.
The third quarter report season is winding down. Cisco and Wal-Mart are a focus this week.
Volume on North American equity markets are expected to be lower than average this week due to the partial (bank) holiday on Tuesday.
Jon noted in his letter on Friday that the S&P 500 Index on average since 1954 realized a return of -0.03% during the week of November Options Expire (i.e. this week). Following is a link to the report:
http://www.equityclock.com/2014/11/06/stock-market-outlook-for-november-7-2014/
Remember: One of the strongest periods during the year for the S&P 500 Index is the days before and just after U.S. Thanksgiving (November 27th this year.
Short and intermediate technical indicators for broadly based equity indices around the world and most sectors (except Mines & Metals and Energy) are overbought, but have yet to show signs of peaking.
Seasonal influences for economic sensitive sectors are positive until at least the first week in January (particularly during Mid-term election years). The four year Presidential cycle low was set on October 15th for North American equity markets.
International influences remains a concern including political instability in Ukraine, Jerusalem, Iraq and Syria.
The Bottom Line
Preferred strategy is to hold current equity positions and to add to positions on weakness. Preferred sectors included Technology, Consumer Discretionary, Industrials and Materials.
Possible sleeper: Mines & Metals! The sector enters its period of seasonal strength next week. Individual stocks in the sector are showing early technical signs of bottoming at oversold levels.
Monitored List of Technical/Seasonal Ideas
Green: Increased score
Red: Decreased score
A score of 1.5 or higher is needed to maintain a position
Disclaimer: Comments, charts and opinions offered in this report by www.timingthemarket.ca and www.equityclock.com are for information only. They should not be considered as advice to purchase or to sell mentioned securities. Data offered in this report is believed to be accurate, but is not guaranteed. Don and Jon Vialoux are Research Analysts with Horizons ETFs Management (Canada) Inc. All of the views expressed herein are the personal views of the authors and are not necessarily the views of Horizons ETFs Management (Canada) Inc., although any of the recommendations found herein may be reflected in positions or transactions in the various client portfolios managed by Horizons ETFs Management (Canada) Inc.
Individual equities mentioned in StockTwits are not held personally or in HAC.
Horizons Seasonal Rotation ETF HAC November 6th 2014
Copyright © EquityClock.com


![clip_image002[5] clip_image002[5]](https://advisoranalyst.com/wp-content/uploads/HLIC/6075bc13f30152c60566d4157d207f85.png)


