
by Gregory Harmon, Dragonfly Capital
So the latest ‘sky is falling’ concern seems to be around the strength in Utilities stocks. The view is that Utilities outperforming means that the defensive sector is leading and the broad market is about to crash. Or something like that. I guess it does not matter coal and oil prices are tanking. What ever. But is it true that Utilities are leading? Well yes if you cherry pick your timeframe. Lets take a look.
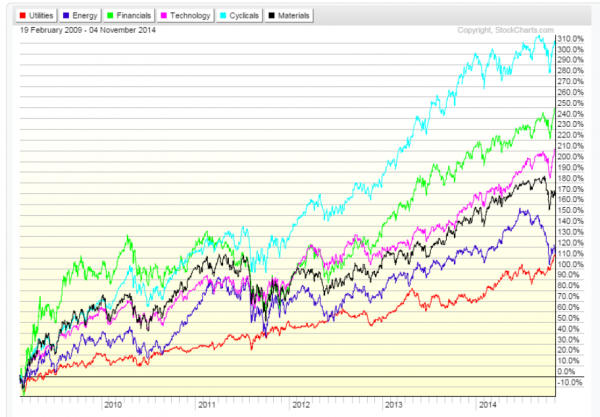
The performance chart above compares the Utilities sector ETF to the Energy, Financials, Technology , Materials and Cyclicals sector ETF’s. This one looks at the performance since the deep bottom in March of 2009. Notice which has led the way, Cyclicals, and which has lagged behind Utilities. Ok maybe this timeframe is too long.
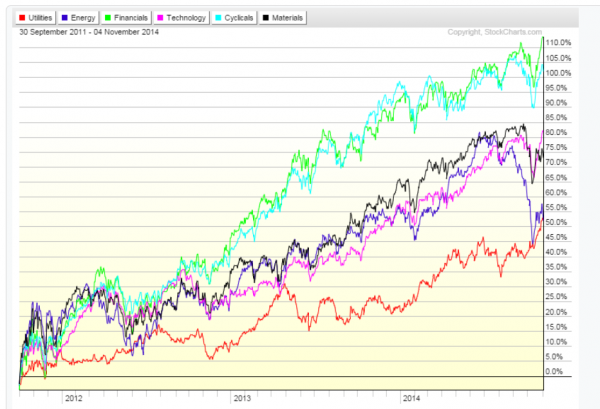
In the second chart, the look back is to the October 2011 low in the S&P 500. What does this chart say? Well pretty much the same thing. Utilities have lagged the Cyclicals and Financials by a factor of over 2:1. Hmm, maybe this timeframe is too long as well. Lets get a little closer.
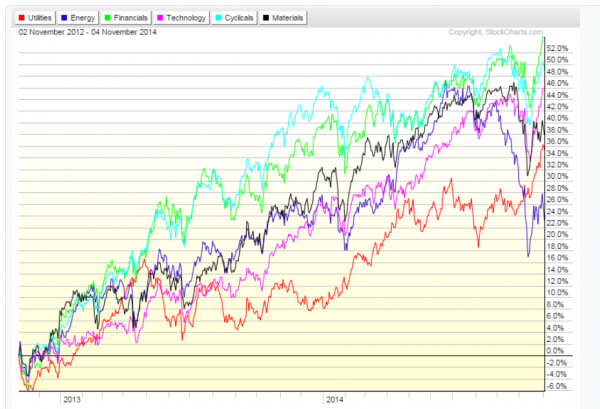
The third chart shows the performance of these sectors since November 2012. This is the last time (before 3 weeks ago) that the S&P 500 touched the 50 week moving average. And what does it show/ Well the Utilities sector is not dead last anymore, but Cyclicals and Financials are still leading the charge higher. Ok, need to get closer still.
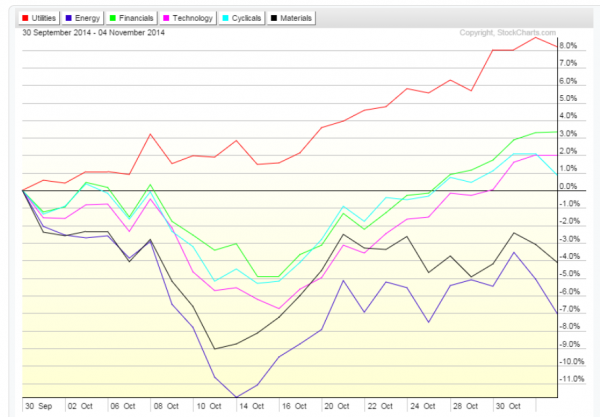
I played around with the chart, and if you look at the performance since the start of the 4th Quarter the Utilities do stand out. This must be the starting point where everyone is focusing on. Ok. So over the last 5 weeks Utilities have outperformed. Is that shocking? After all the S&P 500 was moving towards its first 10% pullback in like forever and was going to crash right? If there was ever a timeframe that Utilities should out perform this would be it. Will it continue? If it does, and for a prolonged period of time then this could be a concern. Oh, but one more chart first.
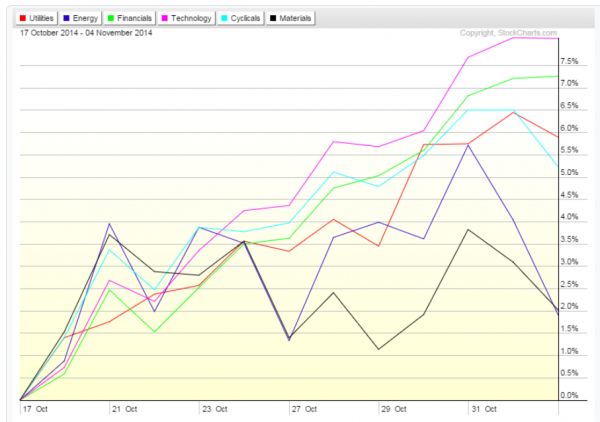
Remember the market bottomed on October 15th. Since then stocks have been recovering. Oh, and the Utilities sector has already lost its leadership position. This could always reverse again but doesn’t it raise questions about the concern over Utilities leading? If a broad market concern requires cherry picked data to back it up you should be suspect. Was the data picked to create a story or was the generated from the prevailing data?
Get my book, Trading Options: Using Technical Analysis to Design Winning Options Trades.
Copyright © Dragonfly Capital