by Rob Hanna, Quantifiable Edges
With the calendar moving from October to November, it has now entered its “Best 6 Months”. The “Best 6 Months” tendency was first published by Yale Hirsch, founder of the Stock Trader’s Almanac, in 1986. The concept behind the “Best 6 Months” is simple. Seasonality suggests that over the last several decades the market has made a massive portion of its gains between November and April. And during the remaining 6 months, it has generally struggled to make headway.
Additionally, the market shifted into the 3rd year of the Presidential cycle. Here at Quantifiable Edges we measure the Presidential Cycle years from November – October rather than January – December. That allows the cycle years to better match up with the elections, which take place in early November. The 3rd year of the Presidential Cycle has been a strong one.
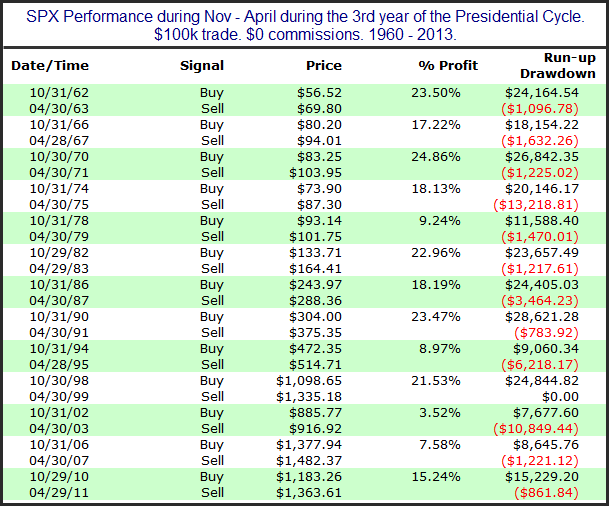
When the Best 6 Months and the 3rd Year of the Presidential Cycle have been active at the same time, the results since 1960 have been outstanding. In the table below I have listed out each instance.

All 13 instances since 1960 have shown gains. Of course there have been drawdowns along the way. The 1974-75 period saw SPX pull back 13.2% from its October closing price before rebounding and finishing April 18.1% above the October closing price. And in 2002-03 there was a 10.85% drawdown from the October close before finishing April 3.5% above it. But overall the stats have been incredibly lopsided. The average 6-month period saw a net gain of 16.5%. The average run-up (from the October close) was 18.7% and the average drawdown just 3.3%. Long-term seasonality does not get any better.
Originally published here.
Copyright © Quantifiable Edges


