Europe
November 3, 2014
by Jeffrey Saut, Chief Investment Strategist, Raymond James
Now is not the time to sell stocks. The time to raise some cash was back in July and August. We advised doing so and that call was not looking very good until the last few weeks. But, now is not the time to sell!
... Jeffrey Saut, various TV interviews, the week of October 12, 2014 (as paraphrased)
At the risk of looking like a sycophant, I quote myself this morning because in mid-October investors were worried the equity markets were about to fall off of a cliff with the S&P 500 (SPX/2018.05) down 9.8% from its intraday high of September 19th, 2014 to its intraday low of October 15th. Unfortunately, I left for Europe on October 16th and never had time to explain why you should not be selling stocks and why you should have put some money back to work, although my colleague Andrew Adams did a really good job of emphasizing why October 15th and 16th had a very good chance of representing a tradable bottom. I had actually thought the envisioned 10% - 12% pullback had begun in July when all the divergences commenced (small/mid-caps down, large caps up, Dollar Index going vertical, the advance/decline line falling, etc.). Obviously that “call” proved premature until late September/October when the large capitalization stocks finally followed their small/mid-cap brethren into the netherworld. The pullback culminated with the October 15/16th “two-step” that left the NYSE McClellan Oscillator oversold. The number of stocks below their respective 10/30/50-day moving averages also suggested an oversold condition, not to forget there were more “selling climaxes” on those two days than we have seen since the October 2011 “undercut low.” A selling-climax is when a stock trades down to a new 52-week low and then closes near the high of that session’s trading range; and that closing price needs to be above the previous Friday’s closing price. Obviously, as can be seen in chart 1 (page 3), mid-October represented extreme selling-climaxes and the resulting throwback rally has been impressive.
Said throwback rally has lifted the SPX ~11% from its October 15th intraday low (1820.66) in a rise that has been absolutely breathtaking! Also along the breathtaking line has been the upside “blast” off of the recent lows. As Jason Goepfert, of the must have SentimenTrader, writes:
For the past 10 days, buyers have pushed the S&P 500 so far, so fast, that it has traded more than 0.5% above its 5-day average every day. The reason this is so unusual is that a 5-day average is responsive, and changes quickly with even minor weakness in prices. Coming off of a six-month low within the past three weeks, there have only been two other instances since 1928 that the S&P enjoyed this much of a kick-off blast: 26-Aug-1982 and 23-Oct-2002. Both happened to mark the end of long-term bear markets. ... When the S&P thrust off a low, it tended to sink back over the next week, then push higher again. A month later, the S&P was positive 9 of the 11 times, averaging +2.3%. The two losses were minor, at -0.8% and -2.6%. There were three occurrences among them that were not good. In 1973, 1977 and 2001, stocks saw significant weakness in the months ahead. Other than those, results were impressive with average returns of +21.2% over the next year.
Indeed, as often stated, in secular bull markets all the surprises come on the upside with the exception being the October 1987 stock market crash. Yet, even that disaster was short lived with the “bull” resuming its upward onslaught in December 1987. So what has caused this explosive rally since October 15th?
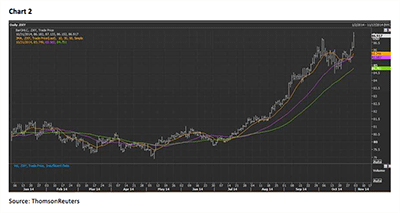
Well, obviously the aforementioned oversold condition set the stage for a rally, but not a move of this magnitude. My call for a trading top in the U.S. Dollar Index of four weeks ago helped usher in the stock slide, but with last week’s interest rate rise that index broke out to a new reaction high (chart 2). I also stuck my neck out on interest rates the week of October 13th, like I did on the trading top “call” for the U.S. Dollar Index the week of September 29th, and so far that interest rate “call” is looking okay. To wit, I think the 10-year T’note made a double top in the charts on, very interestingly, the same day stocks bottomed (October 15th). The first top came in July 2012 at a yield of 1.39% and the second top occurred two weeks ago at 1.8%. Plainly, to a foreign investor, rising stock prices, accompanied by a rising U.S. dollar, is a double-whammy with irresistible consequences. Of course, the dive in gasoline prices has huge positive implications for the U.S. consumer. Then there was the recently better than expected economic data, punctuated by last week’s advance +3.5% GDP report, as well as Japan’s huge QE announcement. However, I think the overriding factor for the two-week triumph is the expectation the Republicans are going to capture the Senate. Here’s what I told accounts in Europe over the past two weeks.
I am an independent voter. I tend to alienate both the Republicans and the Democrats. When the Republicans shut down the government I stated on TV that, “To shut down the government for something you are not going to be able to defund, or repeal (Obamacare), it is a flawed strategy;” and, boy did I get hate mail for those comments! So here was my shtick in Europe for the last two weeks. I think the Republicans are going to re-take the Senate and the Democratic Party is going to be so freaked-out by a Republican House and Senate, with the potential for a Republican president in 2016, they are going to force an intransigent President Obama to move toward the “center.” Ladies and gentleman, a more centric President Obama would be the missing ingredient over the last few years that would cause an explosion in stock prices. Remember that the Reagan Revolution kicked off a powerful rally back in the 1980s. I believe this is the theme that is driving the current rally, and when combined with the aforementioned metrics, it has produced a powerful rally. Yet on a trading basis, the current rally is over-extended. Indeed, the 10-day Advance/Decline Line, at +1888, is WAY overbought since readings over +1750 are considered extreme (see chart 3, on page 4).
As for what I gleaned from some 200 European portfolio managers (PM) over the past two and a half weeks, the biggest surprise was their ubiquitous negative outlook for Europe. I actually think the ECU’s bank president Mario Draghi has finally brought out the bazookas with his tantamount to a QE announcement. I even think he made Frau Merkel “blink” because he also implied he is going to purchase corporate, as well as sovereign, debt. Yes, I know the European debt markets are not as “deep” as the U.S. and was chided on this point by a number of PMs. However, in the stock market psychology drives at least part of the near-term trend and psychology is improving in Euroland, as reflected by last week’s European consumer confidence reports. I think it was the head PM of the Swiss private bank Notz Stucki & Cie who expressed it best in my meeting with his team when he said, “The media keeps bombarding us daily with how bad things are in Europe, so it is pretty difficult to form a more constructive view.” That said, while I do think there is a short/intermediate upside trade for Europe, longer-term there needs to be policy adjustments (especially in France and Italy) if the continent wants to get to a better structural place.
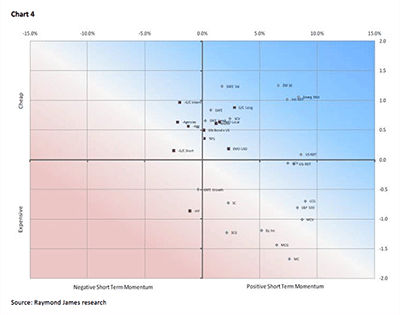
By far what most of the European PMs wanted to discuss was the U.S. political scene, the U.S. markets, and emerging markets (EMs). Speaking to EMs, they are trading at a 10% cash flow discount to Europe and a 25% cash flow discount to the U.S. Interestingly, in Raymond James’ recent Investment Strategy Committee meeting, Nick Lacy referenced chart 4 (page 4), which shows small-cap emerging markets, emerging markets, and international REITs as being timely themes. I was also surprised about the lack of talk on this trip about Ebola, which has sent Americans into a tizzy, just like what happened with bird flu (1968/69) and SARS (2008/09). I did tell PMs that if Ebola does not turn into a pandemic, the airlines are a screaming “buy” since load factors and yields are doing well. Delta (DAL/$40.23/Outperform) is likely the class act for this theme in the U.S., based on my reading of our airline analysts’ recent report titled “Global Airlines Outlook.” I was also repeatedly questioned about the impact of slowing world GDP on America. Fortunately, my friends at Goldman Sachs penned an in-depth report last week analyzing this issue. They concluded that for every 0.5% reduction in the world’s GDP growth rate, the impact on U.S. GDP was a mere -0.13%, and likely less than that! As for earnings and revenues, what can I say to the negative nabobs that have been telling us for four years they were not going to come in according to expectation (chart 5, page 5).
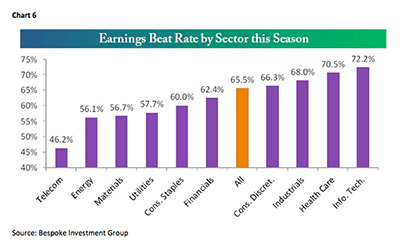
During my European travels I have stated that I think we are at the stage of the secular bull market where nearly everything “works.” Small-caps, mid-caps, large-caps, most macro sectors, and most industry groups, save precious metals and Materials. Yet, on a trading basis, most of the macro sectors are short-term overbought except for Energy and Materials. Since I believe we are heading into a capital expenditure cycle, for that theme I have favored Information Technology, Healthcare, and Industrials. As can be seen in chart 6 (page 5) these macro sectors have an above average earnings “beat rate.” Heading into this week, most of the market indices are indecisive, being trapped between their various day moving averages (DMAs).
The call for this week: Bottoming sequences are a function of time and price. To be sure we have had the “price” part of that equation with the SPX’s 9.8% pullback. The time function, however, has not been achieved. Moreover, V-type bottoms are pretty rare, and that’s what we saw on October 15/16th. However, typically what happens is you get a decline into an “emotional low” like we saw in 1978 and 1979, followed by a throwback rally of some consequence. Then after, six to eight weeks of consolidation, the SPX comes back down and tests the “emotional low,” and sometimes actually breaks marginally below it (an undercut low), setting the stage for the next “leg” to the upside. This is what happened in 1978 and 1979, and it is what happened on October 4, 2011, we were very bullish. Last Friday the world’s markets got caught “flat footed” with Japan’s surprising 80 trillion yen QE announcement and the short-sellers scrambled to cover. Adding to the collective “short squeeze” was end of the month performance machinations. Of interest is the recent action first cleaned out ALL the downside “stop loss” orders and then “cleaned out” all of the upside buy-stop orders (short-sales), which is what typically happens near an inflection points. Today is also session 13 in what appears to be a “buying stampede and buying-stampedes typically last 17 – 25 sessions before they exhaust themselves. So if I could script it, look for the Republicans to win back the Senate leading to a near-term upside blow off in the equity markets, which I would use to take some trading positions off of the table.


