By Andrew Adams, CMT, Raymond James
October 27, 2014
In the June 26th edition of the Morning Tack, Jeff Saut wrote, “I do believe the VIX bottomed last Friday (6/20/14) with an undercut low, much like the undercut low of October 4, 2011 that we identified as the ‘valuation low,’ and recommended should be bought with the SPX trading back then at 1075.” Well that proved to be fitting timing, since from that 6/20 low to the high on Wednesday 10/15, all the VIX did was shoot up about 200%! Now remember that the VIX (CBOE Volatility Index) is essentially the market’s expectation of volatility over the next 30 days, so when the index rises as much and as quickly as it has over the past few months, it conveys that investors believe that things are likely to really start picking up in the trading sessions ahead. Volatility shouldn’t be a dirty word, since, technically, markets can be volatile on the upside too, but these days the term is often synonymous with risk, and an expectation of volatility is generally understood to mean an expectation of lower prices or values.
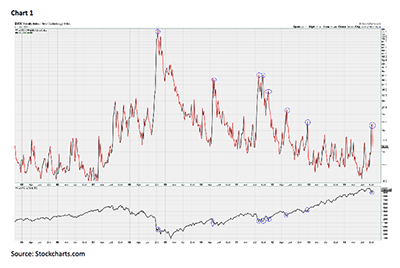
As you can see in chart 1 on page 3, spikes in the VIX have historically been witnessed during intermediate-term corrections and pullbacks when equities are falling, and these spikes can also be used to help identify selling climaxes that may indicate that sentiment has reached an extreme. This is one of the reasons I was so convinced that the sharp moves experienced on Wednesday, October 15th represented a selling climax and believed that stocks could be ready to bounce back. The VIX had skyrocketed to its highest point since late 2012, more than doubling in just about three weeks, and sentiment definitely felt stretched too far to the negative side.
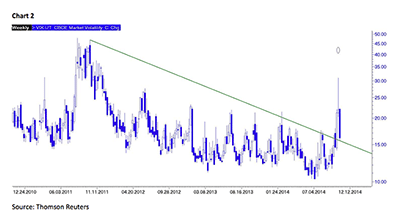
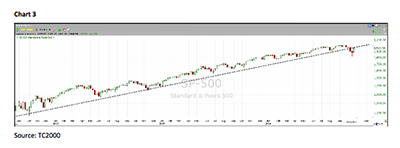
This past week we witnessed the snap-back rally meant to correct the extreme oversold measures we were seeing. The S&P 500 gained 4.12%, bringing its total appreciation to 7.9% since the Wednesday, 10/15 low. At the same time, the VIX collapsed by about half in only a week, recording the fourth largest five-day decline since 1990. This decline brings the Volatility Index to an interesting point on its chart, as it appears to be retesting a trendline that has proven to be very important over the past few years (chart 2). Even more curious, the S&P 500 is concurrently going through a significant retest of its own, hitting resistance after throwing back to the major trendline that had held all its declines since the 2009 bottom before it finally gave way on a closing basis two weeks ago (chart 3). Getting these two simultaneous challenges of respective support and resistance could mean that we have once again hit a point where probabilities favor some more downside, an outlook supported by a few short-term overbought indicators hitting extremes like the percentage of stocks above their 10-day moving average. This measure is at its highest point in the past three months according to Lowry’s, and at levels historically consistent with short-term tops. The result could be that we still get some sort of retest of the recent lows, but we will just have to see because this bounce-back has been much stronger than I initially anticipated.
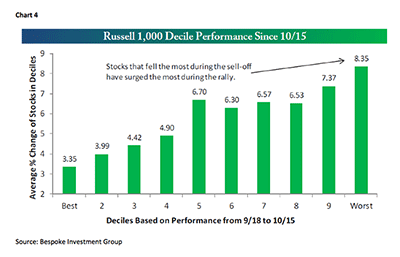
Indeed, breadth readings this week show that we are seeing much of this market taking part in the rally, with about 78% of NYSE issues and 69% of NASDAQ stocks advancing over the last five days. We also had more than double the number of companies on the NYSE hit new 52-week highs than 52-week lows, a nice reversal from what we experienced a couple of weeks ago when we had more companies falling to new lows than at any point since the 2011 correction. Interestingly, the stocks hit hardest during the recent downturn have come roaring back the most, as can be seen from the wonderful study done by Bespoke Investment Group included at the end of this commentary (chart 4). Bespoke broke the market up into deciles by performance during the 9/18-10/15 sell-off and, sure enough, the deciles that fell the most have returned more during this recent rally. This pattern goes against what the textbooks will teach, as they typically recommend buying those companies that demonstrated great relative strength by holding up the best during a pullback. Over the last couple of years, however, the reverse has seemed true, perhaps because the companies that have been punished the most have more ground to recoup. This view does make some intuitive sense, too, since sectors that hold up during a downturn are often defensive and being bought mainly because of their supposed safety. When markets resume their uptrend, there isn’t as much reason to hold these defensive stocks so they are often sold and the money flows back into those perceived “riskier” companies.
A more qualitative piece of evidence that this market is stronger than most expected is the market’s lack of reaction to the news that came out Thursday about the New York City doctor contracting Ebola. Such headlines would have likely been enough to send equities into freefall just a week ago, but investors apparently shrugged off the concerns and showed enough demand to allow all the major indexes to finish in the black on Friday. When a market ignores negative headlines like this, it is usually a very good sign and indicative of underlying strength.
Investor attention has apparently shifted more to earnings season, and the results, thus far, have been healthier than expected, with 80% of S&P 500 companies beating profit estimates and 61% bettering revenue forecasts (source: Bloomberg). Furthermore, many participants likely remain convinced that the Fed will be there to support the market if the situation deteriorates, as the indexes have practically gone straight up since October 16th when St. Louis Federal Reserve Bank President James BULLard (a very fitting surname, by the way) advised policymakers to delay the end of quantitative easing until inflation nears the Fed’s target.
This coming week should give us another round of fresh economic news to digest, as the calendar is filled with a few important releases to note. The news flow actually started over the weekend, with the results of the European Central Bank’s stress test of banks in the Euro currency bloc. One in five banks reportedly failed the stress test at the end of last year, according to Reuters, but most have since repaired their finances, so we shall see today how investors view that news. The announcement of Pending Home Sales for September is due at 10 a.m. EDT today, and we get updated Durable Goods Orders and Consumer Confidence numbers on Tuesday. Wednesday brings the economic news most likely to move the markets, when we get the Federal Open Market Committee’s most recent policy statement. The advance estimate for U.S. GDP the third quarter is due Thursday. These latter two announcements will only add to the intrigue produced by the busiest week of earnings season, as almost a third of S&P 500 companies will report over the next five days. So there should be no shortage of newsworthy items to discuss and consider this week, and fresh news often brings volatility with it.
And that leaves the call for the week: In short, we are likely due for another round of selling, but we may not make it all the way back down to the recent lows if this current bout of strength is to be believed. Still, the S&P 500 has hit resistance while the VIX has hit support, a potential combination for lower prices, so I advise some caution here and it may make sense to wait for a better entry point for any new purchases.


