(Editor’s Note: No pre-opening comments today)
Interesting Charts
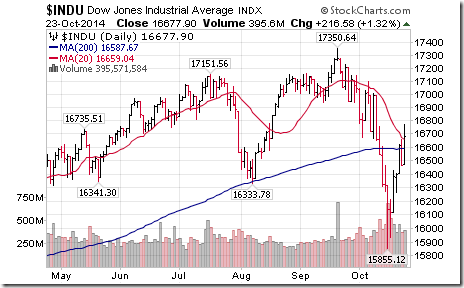
More confirmation that U.S. equity markets bottomed on October 16th! The Dow Jones Industrial Average moved above its 20 and 200 day moving averages.
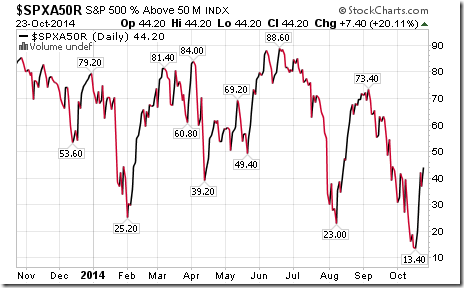
More proof that U.S. equity markets bottomed last week. Percent of S&P 500 stocks trading above their 50 day moving average continues to move higher.
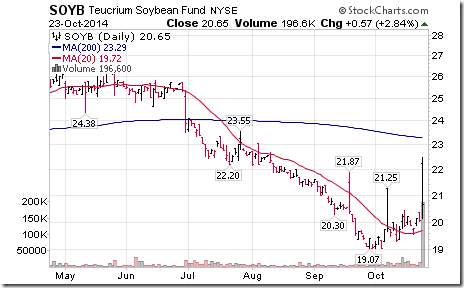
Grain prices continue to move higher, led by soybeans
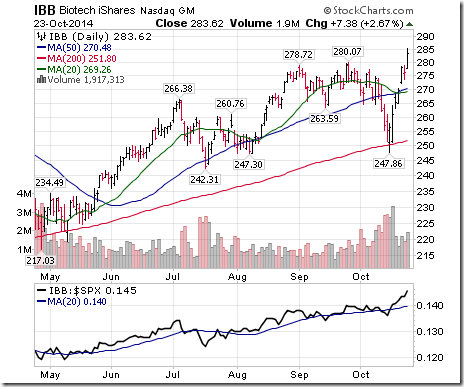
Strongest subsector yesterday was biotech. IBB broke to an all-time high.
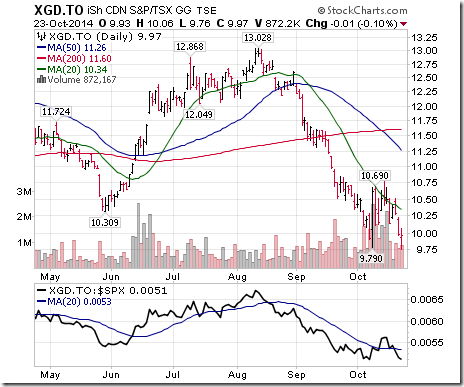
Weakest subsector yesterday was gold equities. ETFs broke to new lows.
Technical Action by Individual Equities Yesterday
Another 16 S&P 500 stocks broke resistance and one stock (CTXS) broke support.
Among TSX 60 stocks, none broke resistance and Goldcorp broke support.
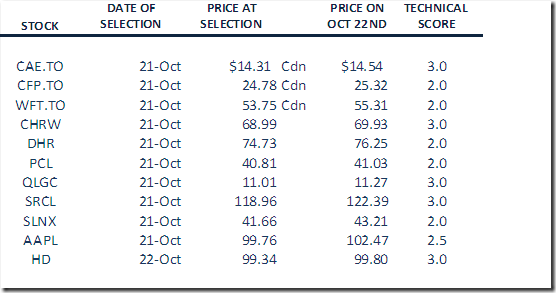
Monitored List of Technical/Seasonal Ideas
Green: Increased score
Red: Decreased score
All securities must maintain a technical score of 1.5 or higher to remain on the list
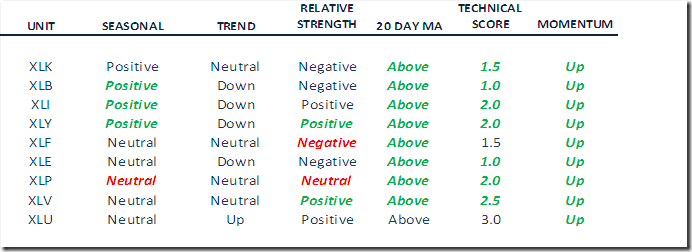
Summary of Weekly Seasonal/Technical Parameters for SPDRs
Key:
Seasonal: Positive, Negative or Neutral on a relative basis applying EquityClock.com charts
Trend: Up, Down or Neutral
Strength relative to the S&P 500 Index: Positive, Negative or Neutral
Momentum based on an average of Stochastics, RSI and MACD: Up, Down or Mixed
Twenty Day Moving Average: Above, Below
Red: Downgrade
Green: Upgrade
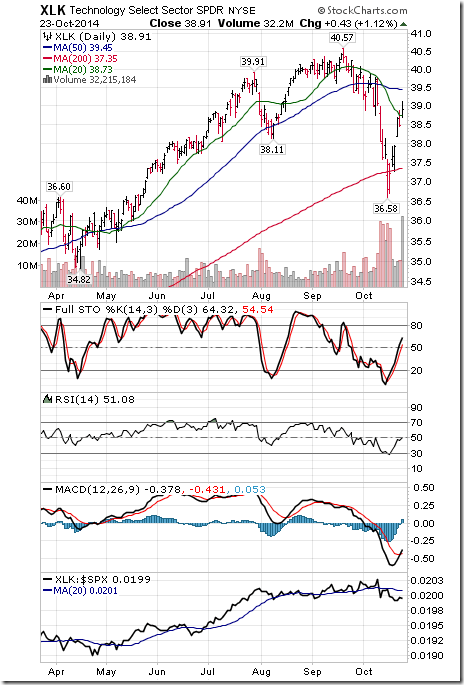
Technology
· Intermediate trend remains neutral.
· Units moved above their 20 day moving average
· Strength relative to the S&P 500 Index remains negative
· Technical score improved to 1.5 from 0.5 out of 3.0
· Short term momentum indicators are trending up.
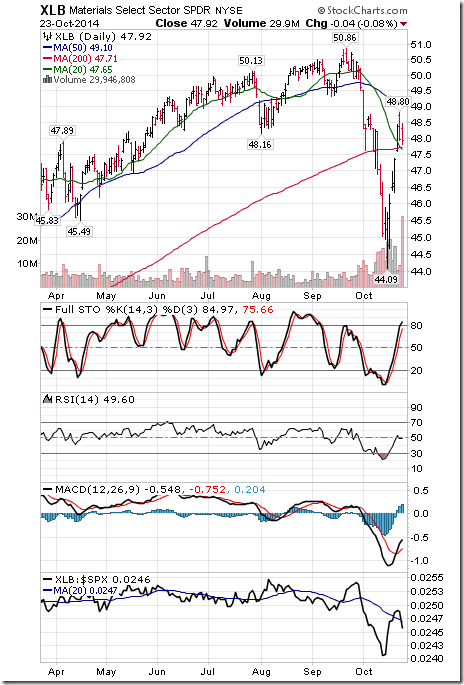
Materials
· Intermediate trend remains down.
· Units moved above their 20 day moving average
· Strength relative to the S&P 500 Index remains negative
· Technical score improved to 1.0 from 0.0 out of 3.0.
· Short term momentum indicators are trending up.
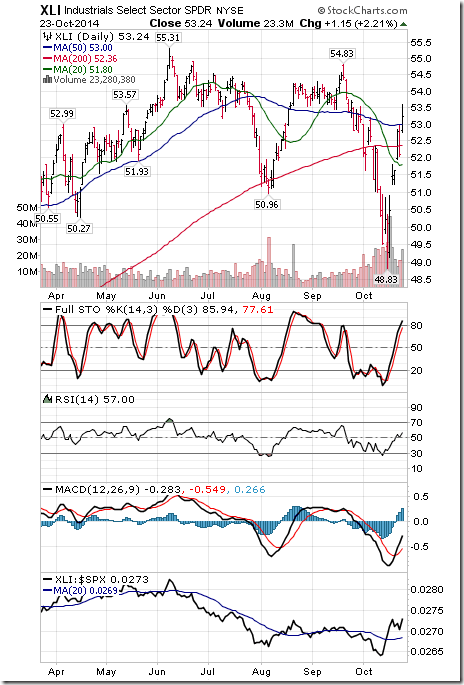
Industrials
· Intermediate trend remains down.
· Units moved above their 20 day moving average
· Strength relative to the S&P 500 Index remains positive
· Technical score improved to 2.0 from 1.0 out of 3.0
· Short term momentum indicators are trending up.
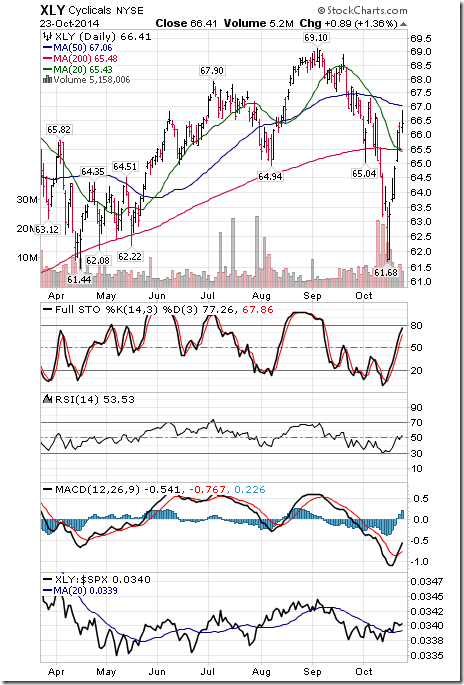
Consumer Discretionary
· Intermediate trend remains down.
· Units moved above their 20 day moving average
· Strength relative to the S&P 500 Index changed to positive from neutral
· Technical score improved to 2.0 from 0.5 out of 3.0
· Short term momentum indicators are trending up.
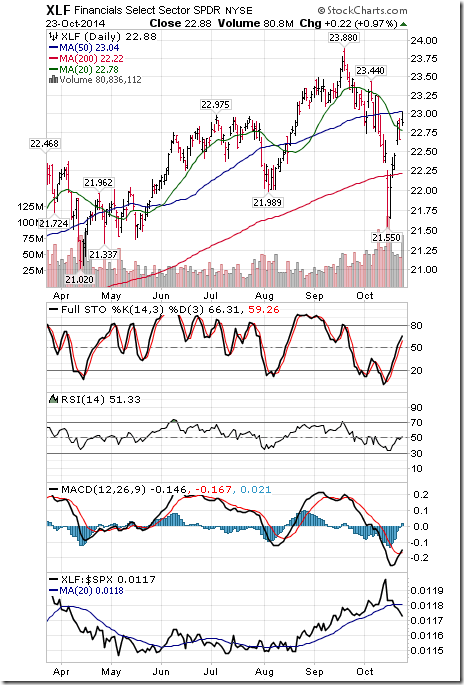
Financials
· Intermediate trend remains at Neutral
· Units moved above their 20 day moving average
· Strength relative to the S&P 500 Index changed to negative from positive
· Technical score remains at 1.5 out of 3.0
· Short term momentum indicators are trending up.
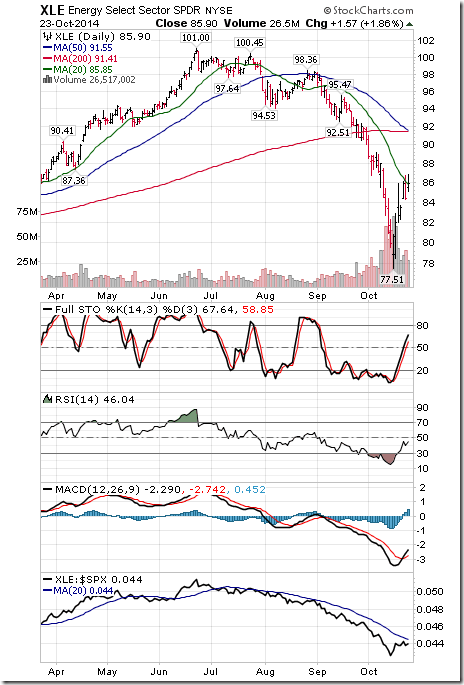
Energy
· Intermediate trend remains down
· Units moved above their 20 day moving average
· Strength relative to the S&P 500 Index remains negative
· Technical score improved to 1.0 from 0.0 out of 3.0
· Short term momentum indicators are trending up
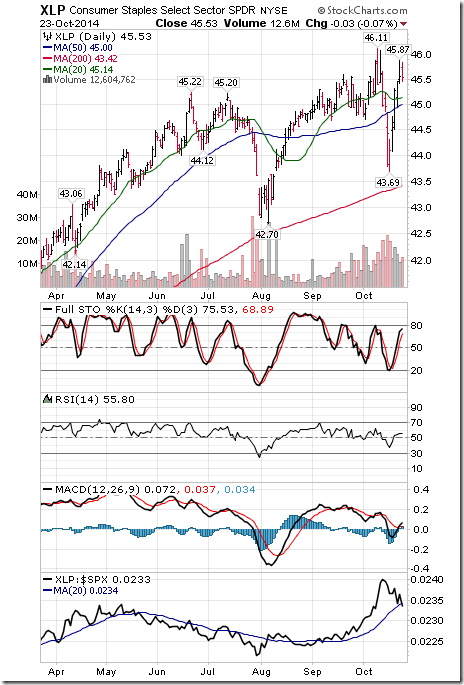
Consumer Staples
· Intermediate trend remains neutral.
· Units moved above their 20 day moving average
· Strength relative to the S&P 500 Index changed from positive to neutral
· Technical score improved to 2.0 from 1.5 out of 3.0
· Short term momentum indicators are trending up.
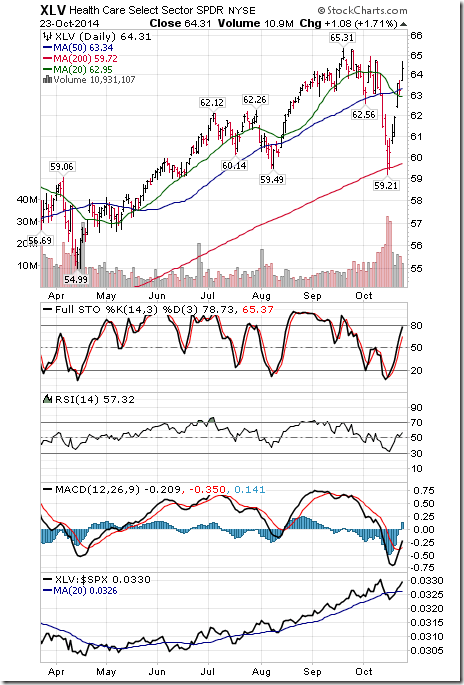
Health Care
· Intermediate trend remains neutral
· Units moved above their 20 day moving average
· Strength relative to the S&P 500 Index remains positive
· Technical score improved to 2.5 from 1.5
· Short term momentum indicators are trending up.
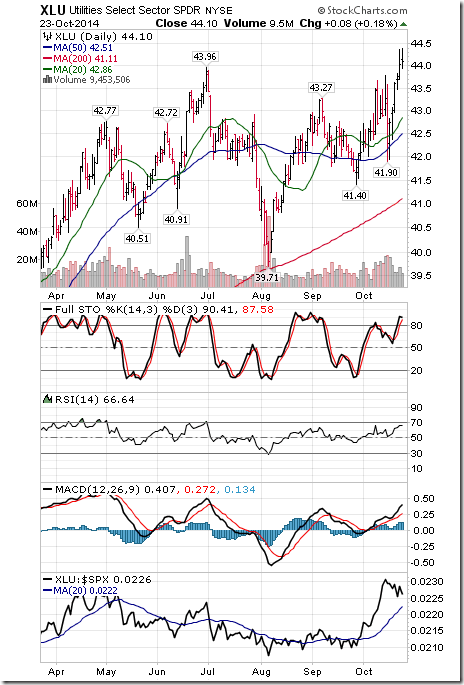
Utilities
· Intermediate trend remains up
· Units remain above their 20 day moving average
· Strength relative to the S&P 500 Index remains positive
· Technical score remains at 3.0 out of 3.0.
· Short term momentum indicators are trending up
Special Free Services available through www.equityclock.com
Equityclock.com is offering free access to a data base showing seasonal studies on individual stocks and sectors. The data base holds seasonality studies on over 1000 big and moderate cap securities and indices. To login, simply go to http://www.equityclock.com/charts/
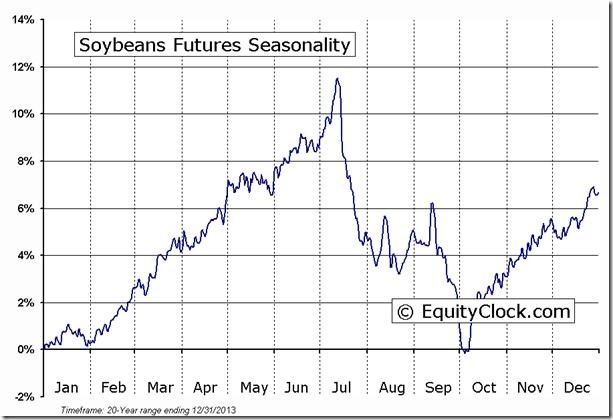
Following is an example:
Disclaimer: Comments, charts and opinions offered in this report by www.timingthemarket.ca and www.equityclock.com are for information only. They should not be considered as advice to purchase or to sell mentioned securities. Data offered in this report is believed to be accurate, but is not guaranteed. Don and Jon Vialoux are Research Analysts with Horizons ETFs Management (Canada) Inc. All of the views expressed herein are the personal views of the authors and are not necessarily the views of Horizons ETFs Management (Canada) Inc., although any of the recommendations found herein may be reflected in positions or transactions in the various client portfolios managed by Horizons ETFs Management (Canada) Inc.
Individual equities mentioned in StockTwits are not held personally or in HAC.
Horizons Seasonal Rotation ETF HAC October 23rd 2014


