by Eddy Elfenbein, Crossing Wall Street
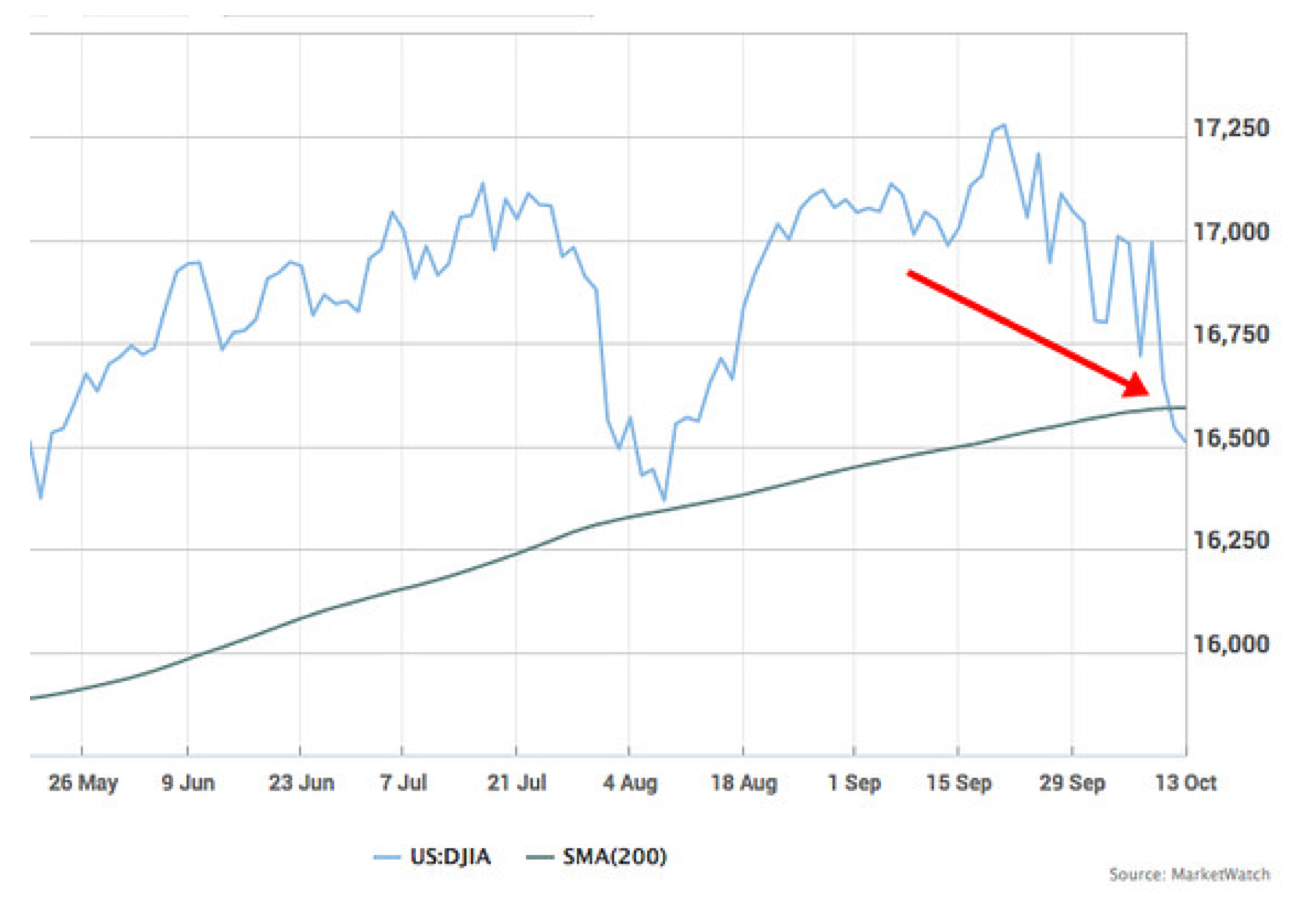
I’m generally not much of a follower of technical analysis, but I don’t dismiss it either. In particular, I like to look at the 200-day moving average. So it was big news for me when the S&P 500 finally closed below its 200-DMA yesterday. That hadn’t happened in nearly two years. This was the second-longest streak in the last 58 years. We came about three months shy of tying the July 1996 to August 1998 streak.
I’ve looked at the historical data, and the 200-DMA has a decent track record. When the S&P 500 is above the 200-DMA, the market does well. When it’s below the 200-DMA, it does poorly. Not very complicated.
Since the beginning of 1933 to yesterday, the S&P 500 has traded above its 200-DMA 67.8% of the time. It’s traded below the 200-DMA the other 32.2% of the time. When the S&P 500 is above its 200-DMA, it’s risen by an annualized rate of 11.29%. But when it’s below the 200-DMA, it’s fallen at an annualized rate of -1.06%.
(Technical note: For consistency, I excluded Saturday trading which lasted until 1952. For the annualized numbers, I assumed a year of 253 trading days.)
Why is this so? I think this is a good example of a dumb rule that works for complex reasons. The complexity part is that the stock market does show momentum. Changes in the market are not normally distributed. Good times tend to lead to good times. Bad times lead to more bad times. The hard part, of course, is spotting when the trends change. The 200-DMA is about the sweet spot in that it’s long enough to capture the trend, but short enough to pick up on reversals. The more dramatic the reversal, the quicker the 200-DMA will flag it.
Copyright © Crossing Wall Street


