by Jon and Don Vialoux, and Brooke Thackray, EquityClock.com
Pre-opening Comments for Friday September 26th 2014
U.S. equity index futures were higher this morning. S&P 500 futures gained in 4 points in pre-opening trade.
Index futures were virtually unchanged following release of third estimate of second quarter GDP. Consensus was an increase in annualized growth to a 4.6% rate versus the second estimate of 4.2%. Actual was 4.6%.
Altria added $0.47 to $45.58 after Bank of America/Merrill upgraded the stock from Neutral to Buy. Target is $50.
Nike gained $6.25 to $86.00 after reporting higher than consensus first quarter revenues and earnings. In addition Janney Capital upgraded the stock from Neutral to Buy. Target is $93.
LinkedIn gained $3.05 to $209.00 after Cowen upgraded the stock from Market Perform to Outperform. Target is $253.
EquityClock.com’s Daily Market Comment
Following is a link:
http://www.equityclock.com/2014/09/25/stock-market-outlook-for-september-26-2014/
Mark Leibovit’s video comments on Apple
Following is a link:
MarketWatch.com Headline: “Wild stock market ride is just beginning”.
Following is a link:
http://www.marketwatch.com/story/wild-stock-market-ride-is-just-beginning-2014-09-26?dist=beforebell
StockTwits Released Yesterday @equityclock
· Technicals by S&P 500 stocks to 11:00 AM: Bearish: 13 S&P 500 stocks broke support. None broke resistance.
Editor’s Note: By the closed 21 S&P 500 stocks had broken support and none broke support.
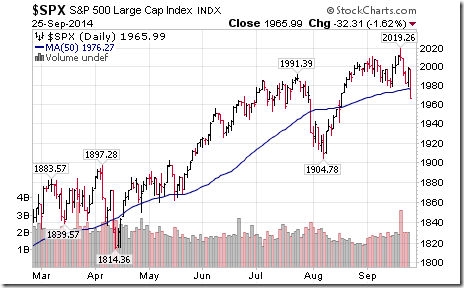
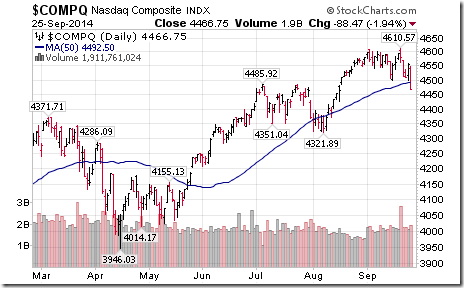
· More evidence of a correction by U.S. indices! The S&P 500 and NASDAQ Composite dropped below their 50 day moving averages
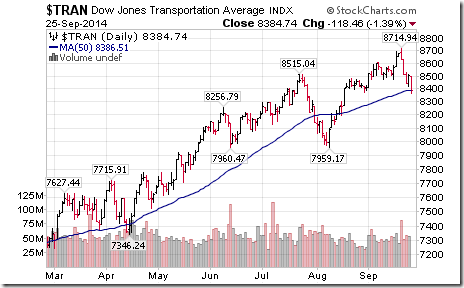
Editor’s Note: Ditto for the Dow Jones Transportation Average!
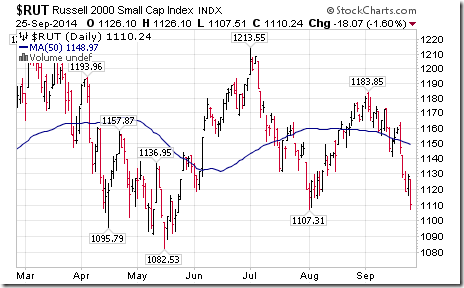
Weakest index is the Russell 2000, down 6.2% since September 3rd and 8.5% since July 3rd.
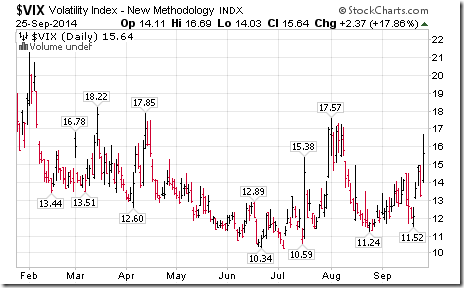
The VIX Index continues to spike.
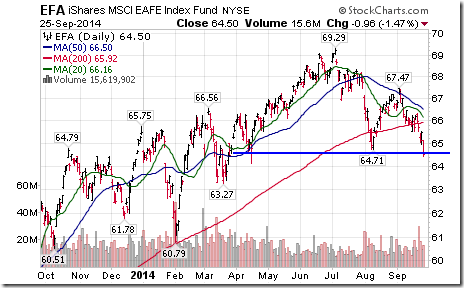
· Technical weakness in equity markets outside of North America is greater. $EFA broke support again.
Other Interesting Charts
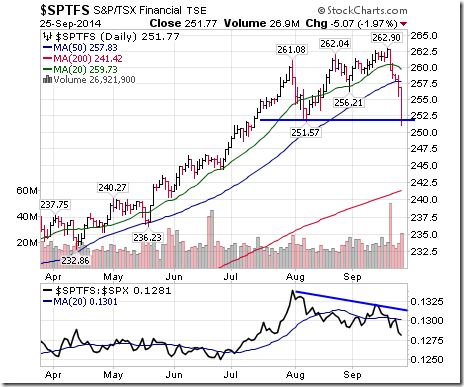
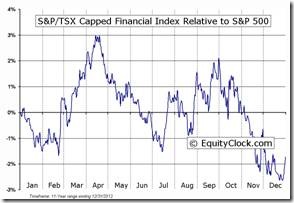
The TSX Financial Services Index has joined other sectors by breaking support and underperforming the market. Seasonal influences are about to turn negative on a relative basis.
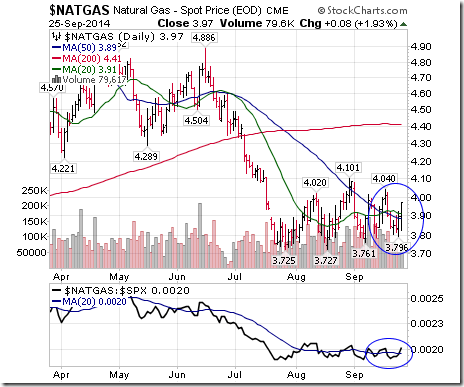
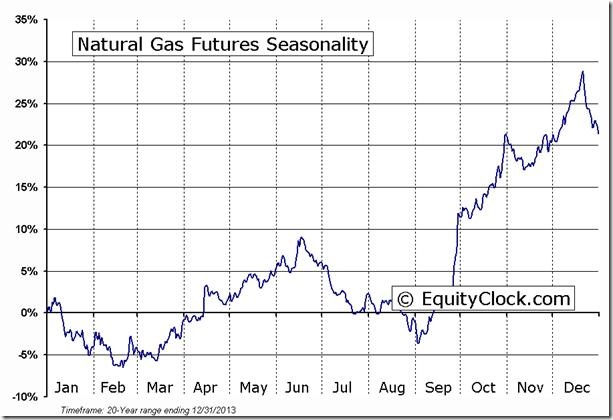
Seasonal influences on Natural Gas finally are starting to show positive technical signs. “Natty” moved above its 20 and 50 day moving averages and began to show positive relative strength. In addition, short term momentum indicators are recovering from oversold levels. A move above $4.11 will confirm a base building pattern.
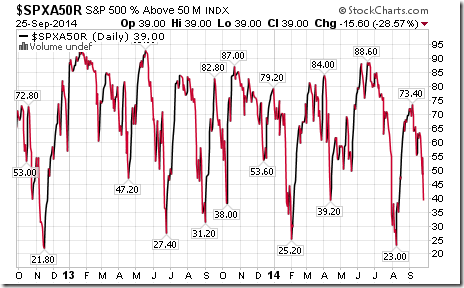
Percent of S&P 500 stocks trading above their 50 day moving average plunged yesterday and already is slightly oversold. However, signs of a bottom have yet to be shown. A bottom frequently occurs in the 20%-25% range.
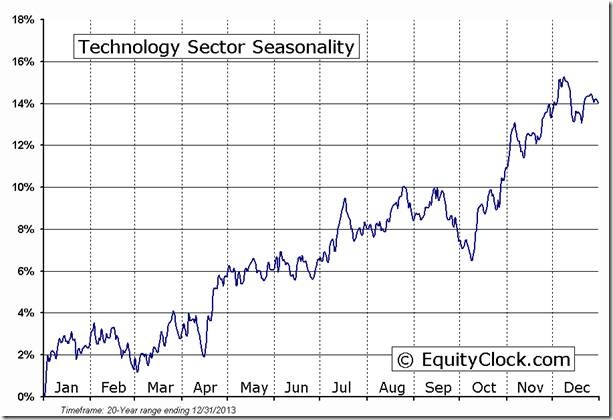
A word of caution on the Technology sector during the next three weeks! The sector has a history of real and relative negative performance between now and the second week in October. Note also that the low in the second week in October provides a seasonal buying opportunity.
TECHNOLOGY Relative to the S&P 500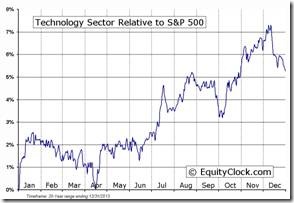 |
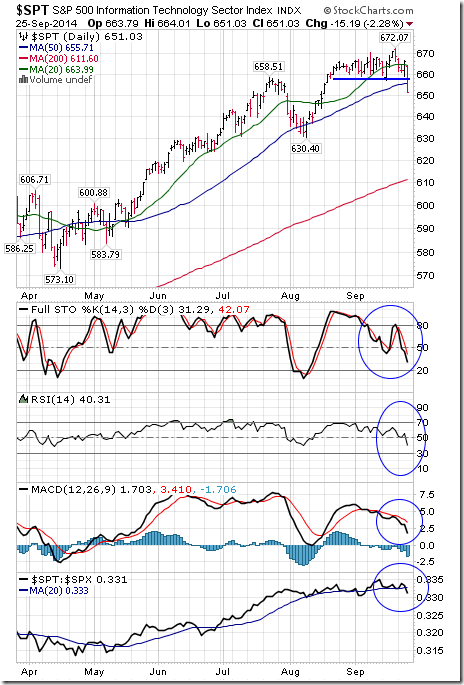
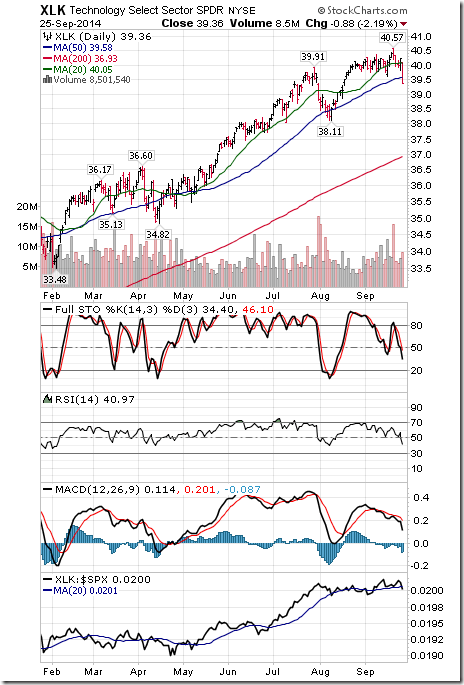
Technicals already are warning about possible short term weakness: Short term support was broken yesterday, the Index fell below its 50 day moving average, short term momentum indicators are trending down and strength relative to the S&P 500 Index has just turned negative.
Fundamentals also are a short term concern. Dan Niles, top U.S. technology analyst noted on Fast Money last night that news from the sector could be brutal as many companies lower their third quarter revenue and earnings guidance during the next three weeks. The sector is the most sensitive of all sectors to valuation of the U.S. Dollar Index because more than 60% of revenues and earnings from the biggest companies in the sector come from outside of the U.S. A strong U.S. Dollar Index will significantly reduce third quarter revenues and earnings when consolidated, particularly revenues and earnings coming from Europe and Japan.
Monitored Technical/Seasonal Trade Ideas
A security must have a Technical Score of 1.5 – 3.0 to be on this list.
Green: Increased Technical Score
Red: Reduced Technical Score
FP Trading Desk Headline
FP Trading Desk headline reads, “Should equity markets be stressed about political risks”? Following is a link:
Special Free Services available through www.equityclock.com
Equityclock.com is offering free access to a data base showing seasonal studies on individual stocks and sectors. The data base holds seasonality studies on over 1000 big and moderate cap securities and indices. To login, simply go to http://www.equityclock.com/charts/
Following is an example:
FUTURE_NG1 Relative to the S&P 500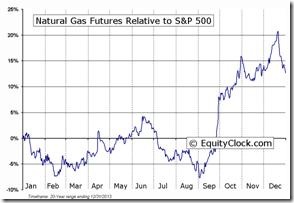 |
FUTURE_NG1 Relative to Gold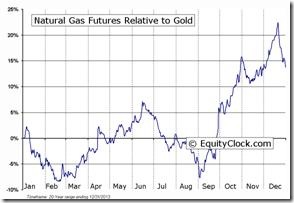 |
Weekly Technical Review of Select Sector SPDRs
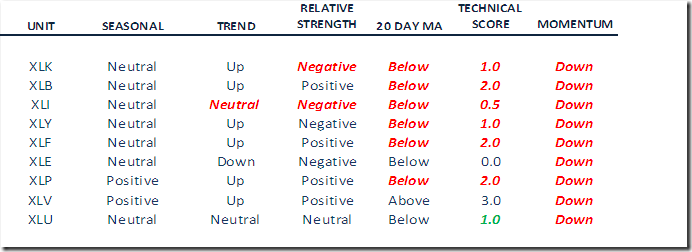
Summary of Weekly Seasonal/Technical Parameters for SPDRs
Key:
Seasonal: Positive, Negative or Neutral on a relative basis applying EquityClock.com charts
Trend: Up, Down or Neutral
Strength relative to the S&P 500 Index: Positive, Negative or Neutral
Momentum based on an average of Stochastics, RSI and MACD: Up, Down or Mixed
Twenty Day Moving Average: Above, Below
Green: Upgrade from last week
Red: Downgrade from last week
Technology
· Intermediate trend remains up (Score: 1.0)
· Units fell below its 20 day moving average (Score: 0.0)
· Strength relative to the S&P 500 Index changed from positive to negative (Score: 0.0)
· Technical score fell to 1.0 from 3.0 out of 3.0.
· Short term momentum indicators are trending down.
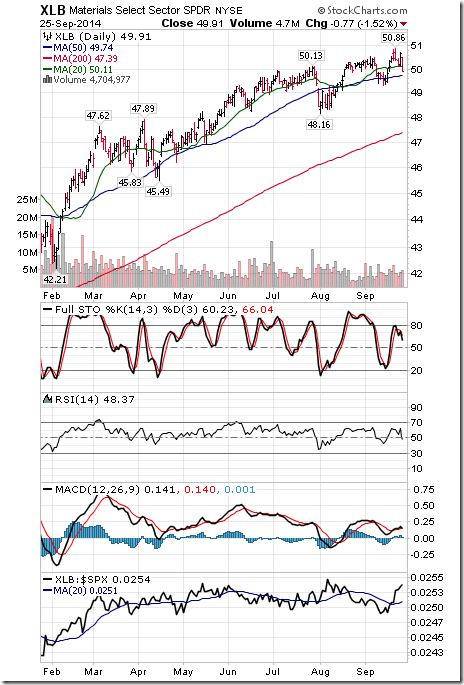
Materials
· Intermediate trend remains up.
· Units fell below their 20 day moving average yesterday
· Strength relative to the S&P 500 Index changed to positive from neutral
· Technical score slipped to 2.0 from 2.5 out of 3.0.
· Short term momentum indicators are trending down.
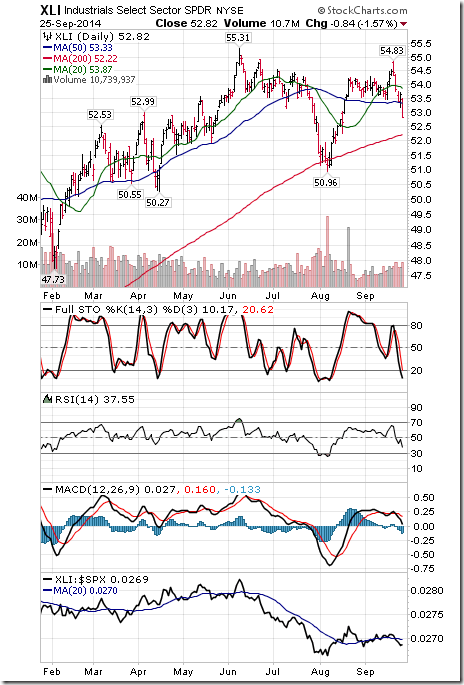
Industrials
· Intermediate trend changed to Neutral from Up on a move below $53.45
· Units fell below their 20 day moving average
· Strength relative to the S&P 500 Index changed to negative from neutral
· Technical score fell to 0.5 from 2.5 out of 3.0.
· Short term momentum indicators are trending down
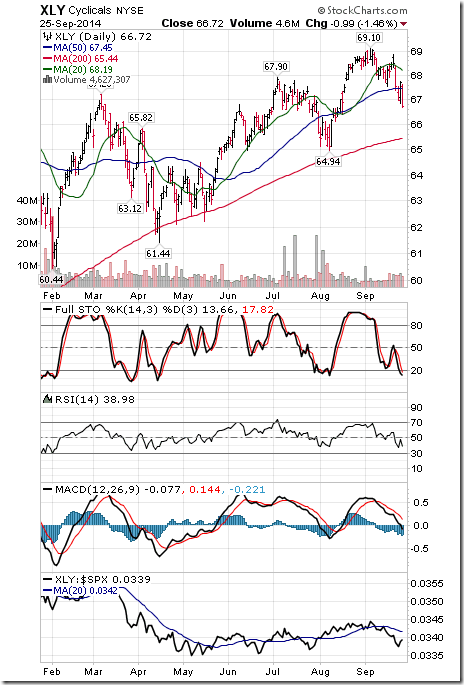
Consumer Discretionary
· Intermediate trend remains up
· Units fell below their 20 day moving average
· Strength relative to the S&P 500 Index remains negative.
· Technical score fell to 1.0 form 2.0 out of 3.0.
· Short term momentum indicators are trending down.
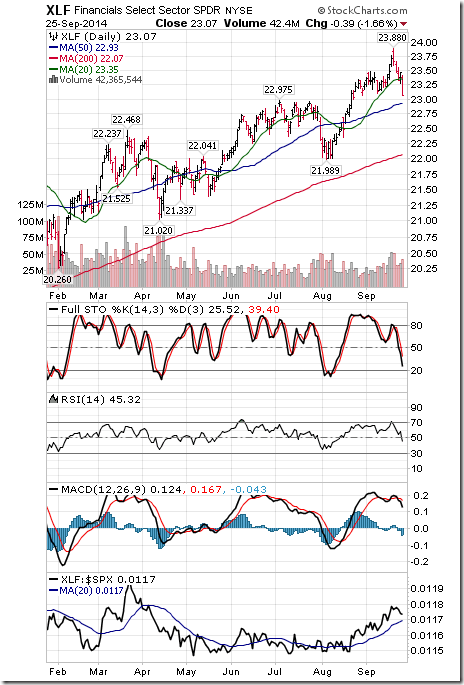
Financials
· Intermediate trend remains up
· Units fell below their 20 day moving average
· Strength relative to the S&P 500 Index remains positive
· Technical score slipped to 2.0 from 3.0 out of 3.0
· Short term momentum indicators are trending down.
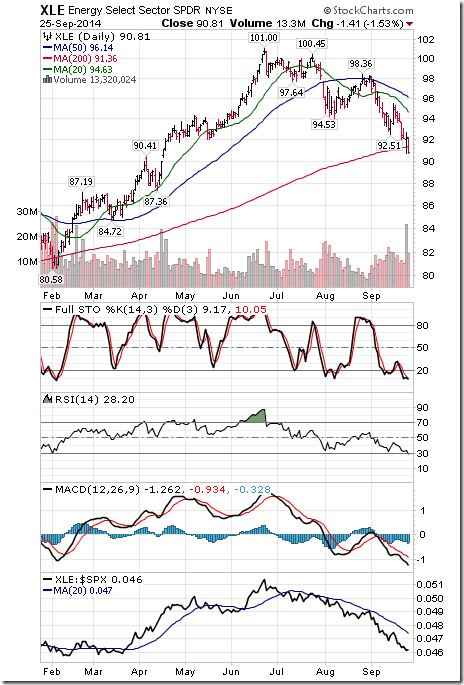
Energy
· Intermediate trend remains down.
· Units remain below their 20 day moving average
· Strength relative to the S&P 500 Index remains negative.
· Technical score remains at 0.0 out of 3.0.
· Short term momentum indicators are trending down, but are deeply oversold.
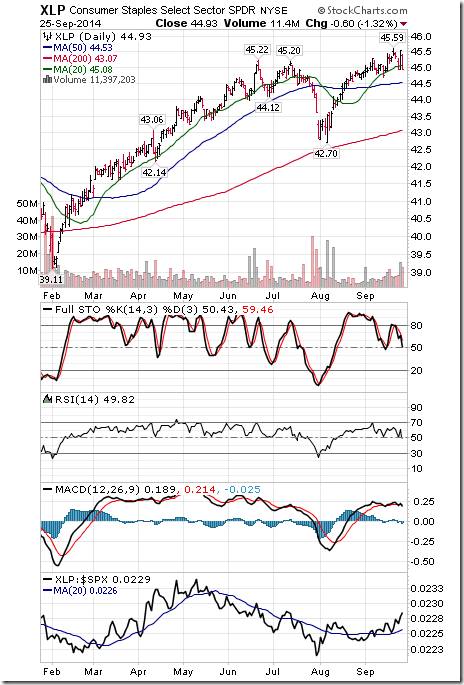
Consumer Staples
· Intermediate trend remains up.
· Units fell below their 20 day moving average yesterday
· Strength relative to the S&P 500 Index remains positive
· Technical score dropped to 2.0 from 3.0 out of 3.0
· Short term momentum indicators are trending down.
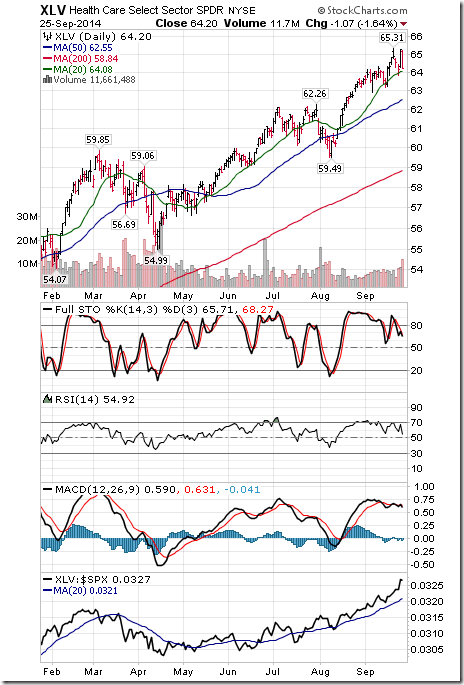
Health Care
· Intermediate trend remains up
· Units remain above their 20 day moving average
· Strength relative to the S&P 500 Index remains positive
· Technical score remains at 3.0 out of 3.0.
· Short term momentum indicators are trending down.
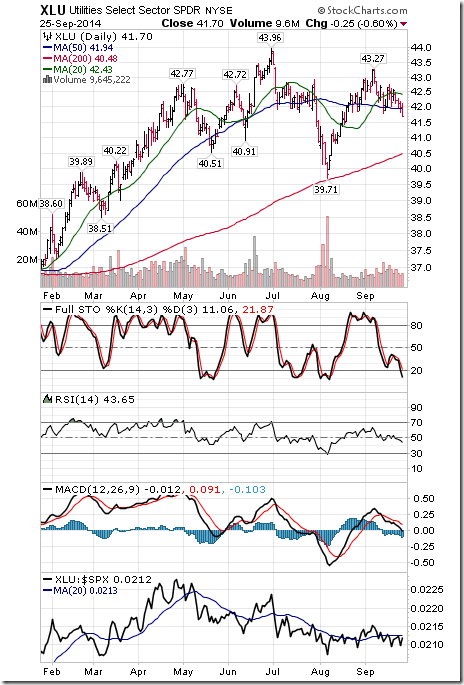
Utilities
· Intermediate trend remains neutral
· Units remain below their 20 day moving average
· Strength relative to the S&P 500 Index changed to neutral from negative
· Technical score improved to 1.0 from 0.5 out of 3.0.
· Short term momentum indicators are trending down.
Adrienne Toghraie’s “Trader’s Coach” Column
|
In Sync With The Markets
By Adrienne Toghraie, Trader’s Success Coach
Over the years many traders have told me that they are out of sync with the markets, with their timing of the markets, and with opportunity that they see in the markets. While computers have given traders so many more opportunities in less time, they do not give a trader the value of tactile sensation, of getting a feel for the markets that comes from hand written charts. Many of the top traders who I have worked with have told me that doing their own charts gave them an edge over traders who did everything by computer.
If you have found your rhythm on a consistent basis and follow your rules without questioning them, this might not be an issue for you. If so, then keep doing what you are doing. If you could use help in this department then read on.
Detailing our senses with information builds the skill of intuition or being at one with the markets. Those skills are built by:
· Reading market material
· Listening to CDs about the markets
· Learning from mentors and teachers
· Writing your business plan out by hand before you put it on the computer
· Writing out your own charts
· Physically going tick by tick and anticipating the next move
Writing out your own charts
Computers do not allow for the tactile sensation that you get from writing out your own charts. This sensation gives information to your neurological system that is invaluable to your being in rhythm with that particular market.
Tracking markets tick by tick
When you lay charts with various time frames on the wall and take a paper to cover up the next move of the markets, you learn how to flow with the markets like a surfer on the ocean. Here is an example of how you should do this:
1. Take a particular commodity that you can track back as far as you can get the data
2. Track a monthly chart by holding up a paper and anticipating the next move
3. Then track it weekly
4. Then track the charts on this commodity daily for the last three years
5. Hourly for the last year
6. Fifteen minutes for the last six months
7. Five minutes for the last three months
When you get to the point of being more right than wrong, then do it in real time and notice the results:
· If you are still lost, then go back and do it again.
· If you start to feel the results, then start tracing another related commodity the same way.
The more charts you do the more your visual and tactile senses will sensitize and flowing with the markets will become second nature.
· Your timing and rhythm will feel like you are an instrumentalist in a jazz band who instantly knows the next notes to play in harmony with his other musicians.
· You will be like the start quarterback who senses the distance and spacing so that he gets the ball to the player who can make a touchdown.
· And, you will have the ability to anticipate opportunities in the markets that only top traders understand.
Conclusion
Sometimes the old fashion methods of doing things have an advantage over new methods. If you are among those traders who would like to experience what flowing with the markets mean to top traders, consider charting and tracking the trades of the past.
Adrienne’s Free Webinars
Adrienne presents free webinars on the psychology of trading
Email Adrienne@TradingOnTarget.com
CNN Fear/Greed Index on U.S. equity markets
The Index dropped another 7 notches yesterday to 11 (Extreme fear). Following is a link:
http://money.cnn.com/data/fear-and-greed/
Disclaimer: Comments, charts and opinions offered in this report by www.timingthemarket.ca and www.equityclock.com are for information only. They should not be considered as advice to purchase or to sell mentioned securities. Data offered in this report is believed to be accurate, but is not guaranteed. Don and Jon Vialoux are Research Analysts with Horizons ETFs Management (Canada) Inc. All of the views expressed herein are the personal views of the authors and are not necessarily the views of Horizons ETFs Management (Canada) Inc., although any of the recommendations found herein may be reflected in positions or transactions in the various client portfolios managed by Horizons ETFs Management (Canada) Inc.
Individual equities mentioned in StockTwits are not held personally or in HAC.
Horizons Seasonal Rotation ETF HAC September 25th 2014
Copyright © EquityClock.com


