by Cam Hui, Humble Student of the Markets
It is good to see academics catch up with how traders think. I recently came across this summary of a research paper called "A New Anomaly: The Cross-Sectional Profitability of Technical Analysis" by Han, Yan and Zhou in CFA Digest published in the Journal of Financial and Quantitative Analysis:
The authors use a common trend-following strategy to measure the predictive ability of technical analysis. They apply their method to portfolios arranged by idiosyncratic volatility and variables related to information uncertainty. They document high abnormal returns relative to standard pricing models that are unexplained by investor sentiment, market timing, or liquidity risk. Such findings, according to the authors, establish a new anomaly.
Han et al tested whether using moving averages to time trades added value:
The authors use a set of 10 volatility decile portfolios as the underlying assets for their technical analysis. For each of the portfolios, the authors focus on the cross-sectional profitability of the MA timing strategy relative to that of the buy-and-hold strategy of the volatility decile portfolios. In the main study, the lag length is 10 days. The authors also test the alternative strategy with lag lengths of 20, 50, 100, and 200 days for the MA portfolios (MAPs).
Moving average strategies added value on a risk-adjusted basis:
The authors find that the 10 MAP returns are positive and increase with the volatility deciles (excluding the highest decile); returns range from 8.42% a year to 18.70% a year. In addition, the capital asset pricing model (CAPM) risk-adjusted returns, or abnormal returns, increase with the volatility deciles (also excluding the highest decile), ranging from 9.31% a year to 21.76% a year. When the authors apply the Fama–French three-factor model, they find the familiar pattern of monotonically increasing returns across 9 of 10 volatility deciles.
How trend following models works
These results are not a surprise to me. I explained the economic basis for trend following models back in 2008 (see Sheeps can make money too!):
A few years ago, I managed equity market neutral portfolios at a firm that was mainly known for commodity trading using trend following techniques, which are well described by Michael Covel in his book. During my tenure there I noticed that while the commodity positions were spread out among various futures contracts they often amounted to a few macro bets (i.e. on interest rates, on the US$, etc.) I came to the conclusion that these models were identifying macroeconomic trends that are persistent and exhibit serial correlation, which creates investment opportunities for patient long-term investors. For example, if the Fed is raising rates the odds are they will continue to raise rates until they signal a neutral or easing bias, i.e. there is a trend to interest rates, which is information that investors can use. The key risk in this class of models is knowing when to exit the trend, as short and long term reversals can be devastating to the bottom line.
The whipsaw problem
What was a surprise, however, is that Han paper did not find that these models do not work well in trend-less markets as these kinds of models are suspectible to whipsaw. (That`s a feature, not a bug.)
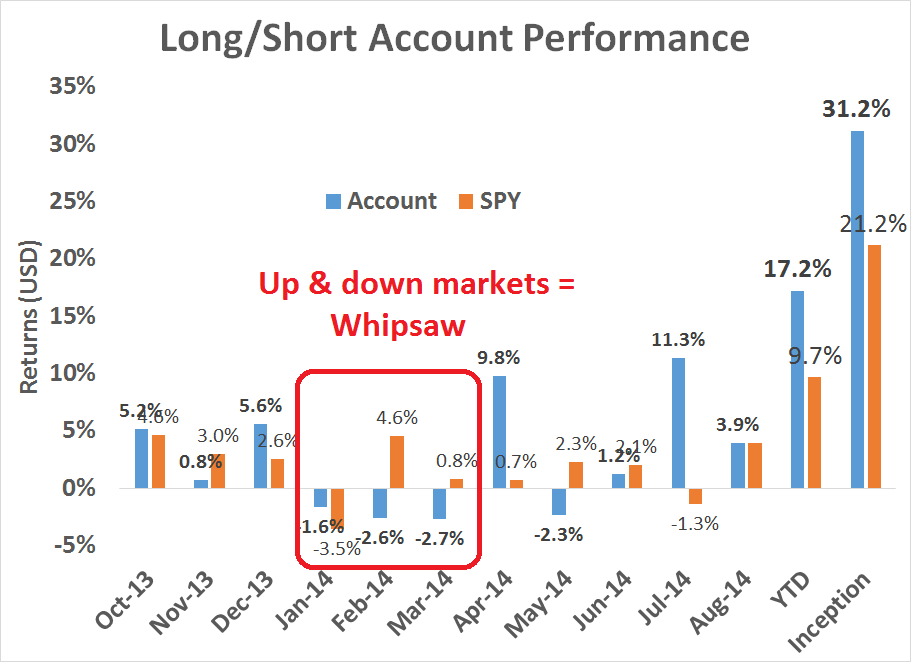
For instance, the latest report card on my own Trend Model account (see Trend Model report card: August 2014) shows solid results. However, as the chart below of account and SPY returns shows, up-and-down stock markets in Q1 resulted in negative returns for the account - a classic whipsaw pattern.
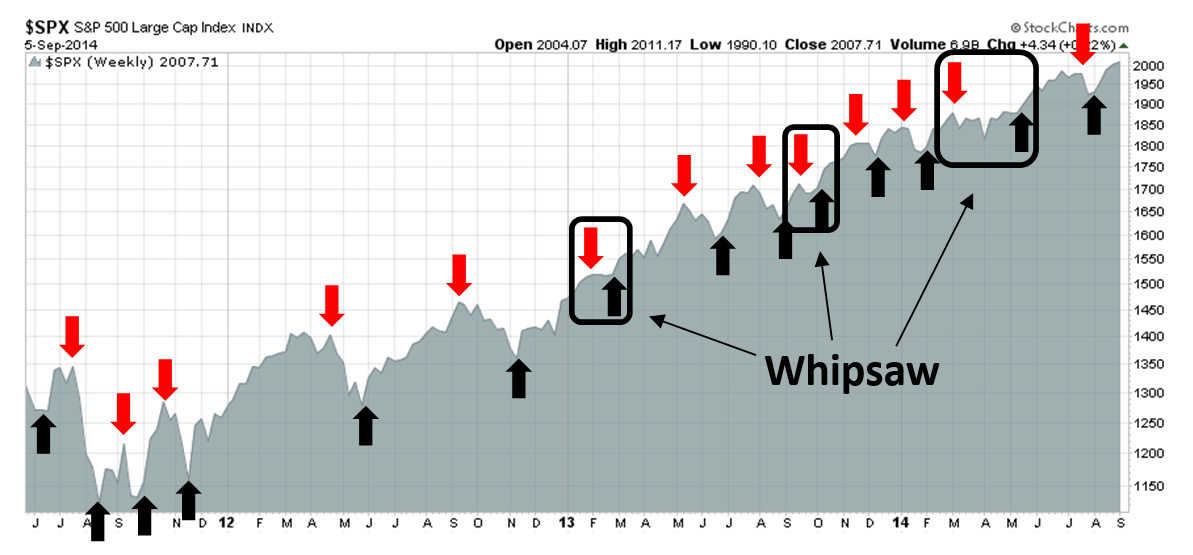
As a reminder, the Trend Model account is based on the application of trend following principles to global equity and commodity prices. The chart below shows the actual real-time (not back-tested) buy and sell signals of the model. I further highlighted the instances when the model suffered from whipsaw. To address that problem, I supplement the trend following model signals with some short-term sentiment models in order to address the whipsaw problem of this class of modeling technique.
Regardless, this research is a form of affirmation that moving average based technical analysis can produce superior risk-adjusted returns. Further, if academics were to further decompose capital market returns in an economic, instead of Fama-French, risk factor mapping, I bet that they will find that these kinds of models are picking up on the serial correlation in economic factor returns.
Copyright © Humble Student of the Markets


