by James Paulsen, Chief Investment Strategist, Wells Capital Management
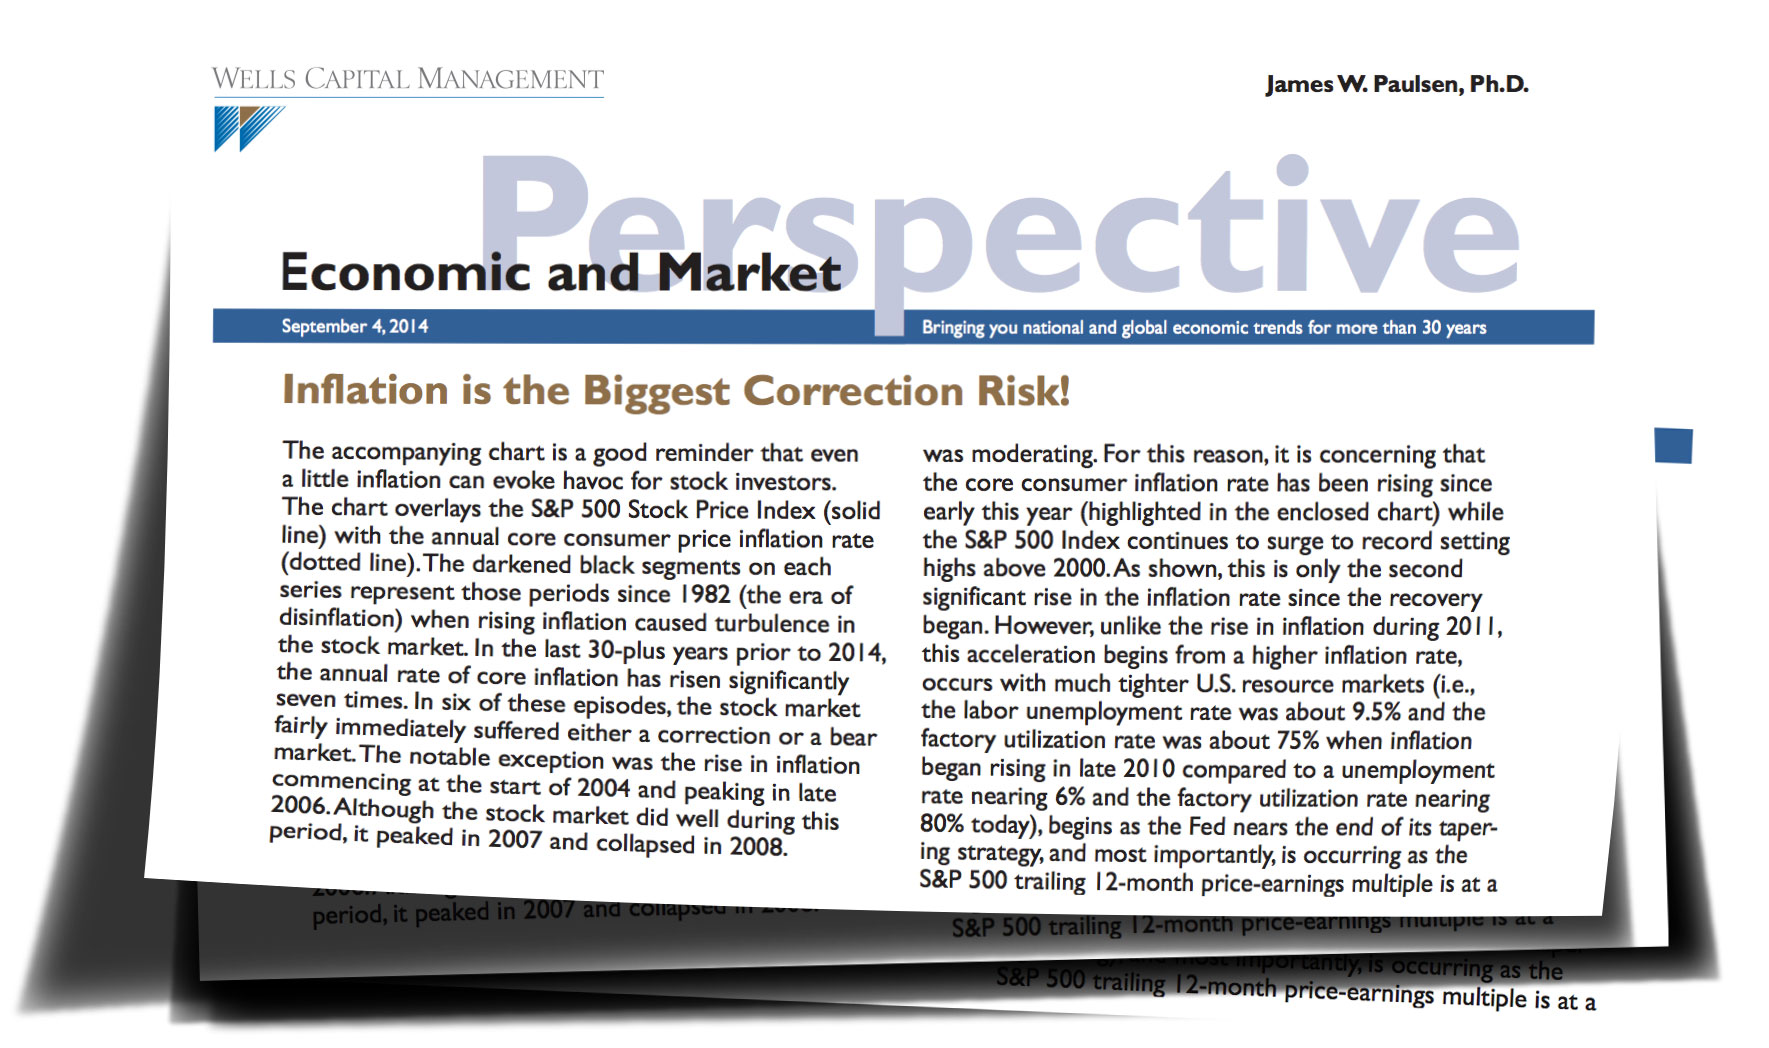
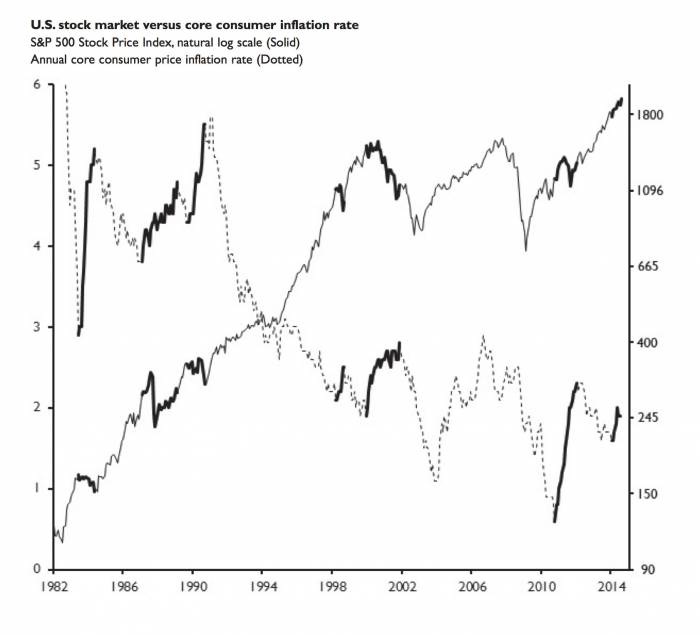
The accompanying chart is a good reminder that even a little inflation can evoke havoc for stock investors. The chart overlays the S&P 500 Stock Price Index (solid line) with the annual core consumer price inflation rate (dotted line). The darkened black segments on each series represent those periods since 1982 (the era of disinflation) when rising inflation caused turbulence in the stock market. In the last 30-plus years prior to 2014, the annual rate of core inflation has risen significantly seven times. In six of these episodes, the stock market fairly immediately suffered either a correction or a bear market. The notable exception was the rise in inflation commencing at the start of 2004 and peaking in late 2006. Although the stock market did well during this period, it peaked in 2007 and collapsed in 2008.
Even in the disinflationary era since 1980, “inflation risk” for stock investors remains unmistakable. Whether the inflation rate increased only slightly (e.g., 1987 and 1998) or rose from very low levels with a consensus seemingly preoccupied by deflation (e.g., 2011), the impact on stock prices from a rise in the inflation rate continues to be pronounced. This chart also highlights how important disinflation has been for the stock mar- ket in recent decades. Most of the 1980s bull market run occurred as the inflation rate declined and it was only interrupted by periods when the inflation rate reaccelerated. Indeed, the almost uninterrupted and steady rise in stock prices during the amazing 1990s bull market was a product of an almost continuous decline in the inflation rate during the decade. Finally, the choppy nature of stocks again evident since 2000 seems at least partially and importantly tied to the increasingly choppy nature of the inflation rate.
Despite less consensus concern about inflation since the 2008 crisis (including ongoing Fed actions illustrating a benign attitude regarding inflation risk), a high level of inflation sensitivity in the stock market remains obvious.
The biggest stock market correction thus far in the current recovery (almost 20% in 2011) occurred coinci- dently with the annual rate of core inflation rising from 0.6% to 2.3%. Similarly, as shown in the chart, the major periods of significant increases in stock prices since 2009 have occurred mostly when the rate of inflation was moderating. For this reason, it is concerning that the core consumer inflation rate has been rising since early this year (highlighted in the enclosed chart) while the S&P 500 Index continues to surge to record setting highs above 2000. As shown, this is only the second significant rise in the inflation rate since the recovery began. However, unlike the rise in inflation during 2011, this acceleration begins from a higher inflation rate, occurs with much tighter U.S. resource markets (i.e., the labor unemployment rate was about 9.5% and the factory utilization rate was about 75% when inflation began rising in late 2010 compared to a unemployment rate nearing 6% and the factory utilization rate nearing 80% today), begins as the Fed nears the end of its taper- ing strategy, and most importantly, is occurring as the S&P 500 trailing 12-month price-earnings multiple is at a recovery high of about 18 times earnings!
We are not suggesting the U.S. economy is imminently headed for runaway inflation. Although possible, particularly considering the unconventionally aggressive monetary policy still being employed in this recovery, we think the odds of a serious inflation problem are re- mote. However, as this chart illustrates, serious inflation is not required for serious stock market turbulence. This country has not faced a profound inflation problem in more than three decades but has still suffered numerous stock market gyrations at least partially resulting from rising inflation anxieties. Perhaps wage pressures and core inflation will remain moderate in the months ahead allowing the stock market to continue higher without interruption. However, as shown in the chart, the core consumer price inflation rate (or wage inflation) probably cannot rise much further without at least temporarily aggravating both the stock and bond markets. While we expect the contemporary bull market to last several more years, it will not likely be a straight line.
Just a little food for thought as the stock market roars ahead and we approach another Payroll Friday (and wage number)???
Copyright © Wells Capital Management


