In recent years, we have regularly seen market participants argue between two investment assets: stocks and bonds. One camp claims that stocks are cheap as recovery continues and earnings keep growing, which will eventually put pressure on bonds and drive yields higher. The other camp argues that the recovery is very weak and stocks are overpriced. As deflation and slowdown fears set in again, bonds will outperform while stocks disappoint. On both sides of the argument exist perma bulls and perma bears, who have instantly high and low targets for both assets.
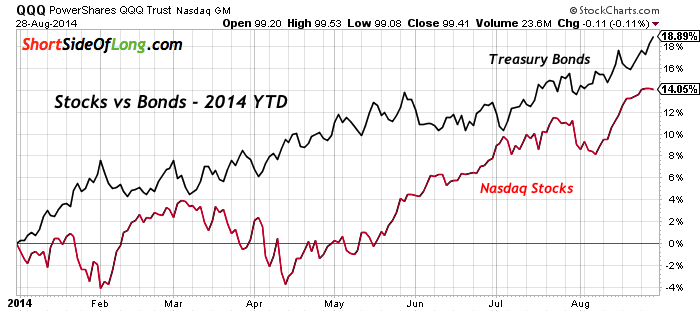
Chart 1: Year to date performance of Tech Stocks vs Treasury Bonds
 Source: Stock Charts (edited by Short Side of Long)
Well… guess what? In 2014, both camps are right. As we can see in Chart 1, higher beta Nasdaq 100 stocks are up 14% year to date, while Treasury Long Bond is up almost 19% (both are total return).
So how can that be? Well, we find ourselves in a period which will most likely be known as “the mother of all easing cycles”. Basically, zero percent rates and additional money printing is pushing up both stocks and bonds simultaneously. And since money velocity hasn’t risen yet, high inflation has not been a problem.
So which asset should investors should buy or continue to hold, and which one should they sell? My personal opinion is that this question is a little bit more difficult to answer, because it is not just as simple as choosing between either one. I will try and answer the question in two parts.
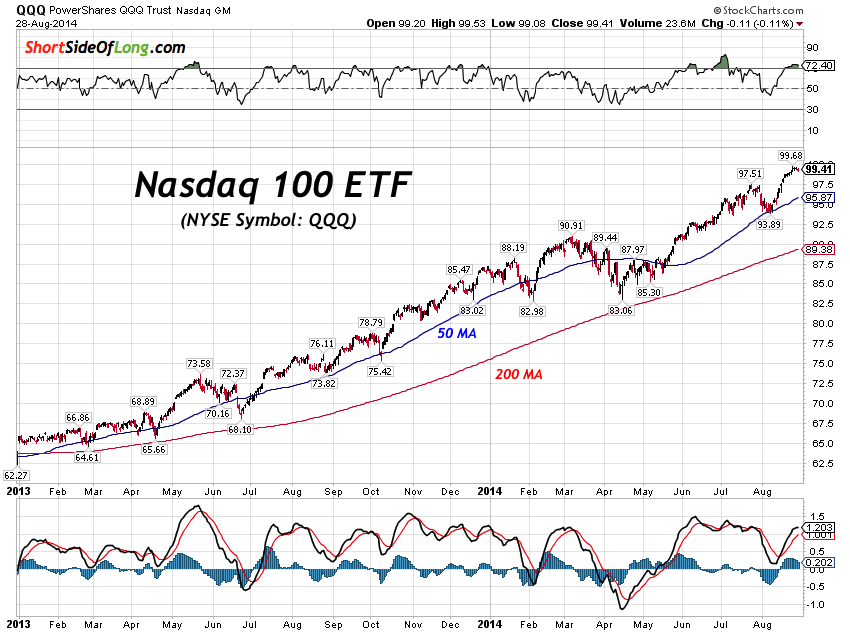
Chart 2: US technology stocks have been rising at extra ordinary pace
 Source: Stock Charts (edited by Short Side of Long)
First of all, year to date chart does not tell the whole story. Instead let us look at the price action for both assets since at least 2013. As you can see Nasdaq 100 has been storming higher and at faster rate too. It hasn’t traded at or below its 200 day moving average since late 2012. While this index is extremely overbought even now, it seems to be stubbornly shaking off any downside risks as it tries to recapture its 2000 peak in a hurry.
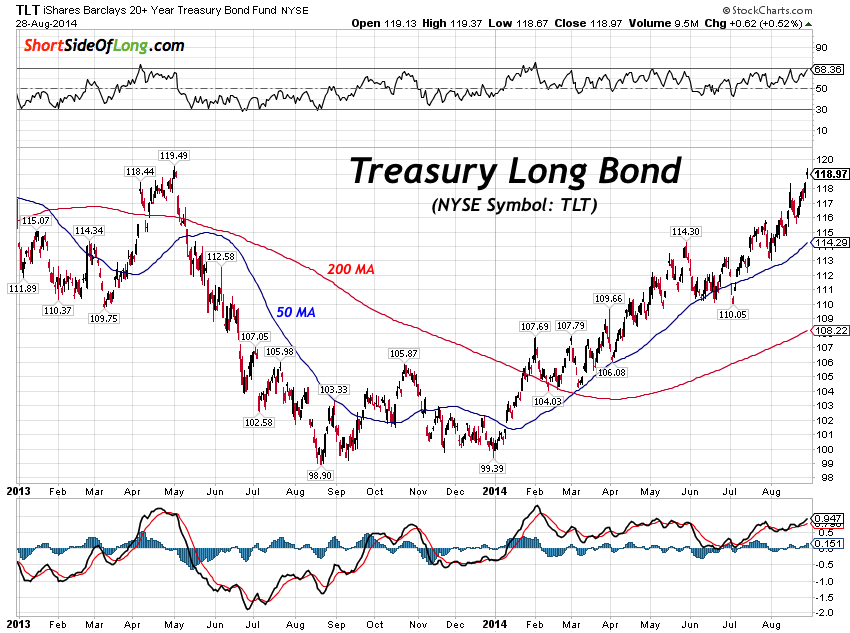
On the other hand, while Treasuries have done better then stocks in 2014, they are only really recovering from the huge drawdowns in 2013. In other words, those who purchased stocks at the beginning of 2013 are up a whole lot more than those who purchased bonds. Therefore, from a contrary perspective, does this mean that stocks are a lot more extended then bonds?
Chart 3: Bonds have rallied, but its only a recovery from the ’13 sell off!
 Source: Stock Charts (edited by Short Side of Long)
Well maybe in the US, but not in a lot of other Developed Markets around the world, where government bonds have been bid up to extreme levels (some yields are actually negative) as fear of bank defaults, deflation and recession worries keeps investors in risk aversion mode. For example, certain government bond markets are just extended as Nasdaq seen in Chart 2. All we have to do is look at the recent several years of performance in German Bunds or the last decade in Japanese JGBs. So, this brings me onto the second point…
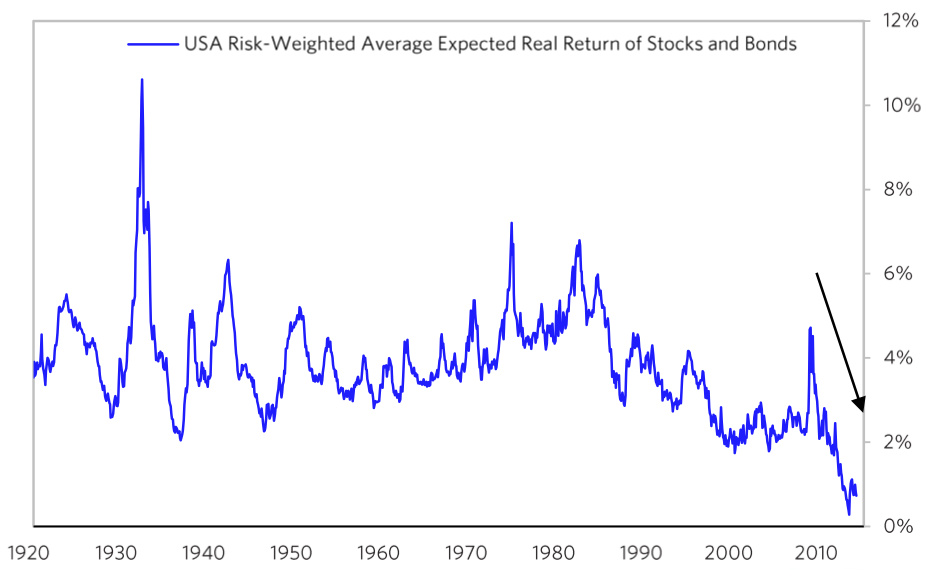
Chart 4: There is decent probability that both stocks & bonds disappoint
 Source: Ray Dalio & BridgeWater
Since we are going through “the mother of all easing cycles”, the other side of the saga could be a disappointment for all investors, both those who favour stocks as well as bonds. Let me first say that as long as the artificial easing continues, noir just by the Fed, but by all other major central banks, things could stay in the current goldilocks environment.
Therefore, these warnings do not necessarily mean that both stocks and bonds sell off tomorrow, but they do imply that returns over the next decade could be very low indeed. According to Bridgewater Hedge Fund, Chart 4 shows that when adjusted for inflation (if you believe the government data), risk-weighted average expected return for both stocks and bonds could be just 1% per annum. That is not only below average, that is actually at the lowest level in modern history.
I think none of us are exactly sure how the end game will play out, as central banks pull back on their easing programs and credit gets tighter, but one thing is for sure. A wise man once said that on Wall Street, there is always a bull market somewhere. Since returns have already been superb, the question is which asset class will benefit next?
Copyright © The Short Side of Long


