Economic News This Week
June Factory Orders to be released at 10:00 AM EDT on Tuesday are expected to increase 0.5% versus a gain of 0.5% in May.
July ISM Services to be released at 10:00 AM EDT on Tuesday are expected to increase to 56.5 from 56.0 in June.
June U.S. Trade Deficit to be released at 8:30 AM EDT on Wednesday is expected to increase to $45.2 billion from $44.4 billion in May.
June Canadian Merchandise Trade Balance to be released at 8:30 AM EDT on Wednesday is expected to show a deficit of $100 million versus a deficit of $200 million in May.
Weekly Jobless Claims to be released at 8:30 AM EDT on Thursday is expected to increase to 310,000 from 302,000 last week.
Preliminary Second Quarter Productivity to be released at 8:30 AM EDT on Friday is expected to record a gain of 1.4% versus a decline of 3.2% in the first quarter.
July Canadian Employment to be released at 8:30 AM EDT on Friday is expected to increase 25,000 versus a 9,400 decline in June. July Unemployment Rate is expected to decline to 7.0% from 7.1% in June.
June Wholesale Inventories to be released at 10:00 AM EDT on Friday are expected to increase 0.4% versus a gain of 0.5% in May.
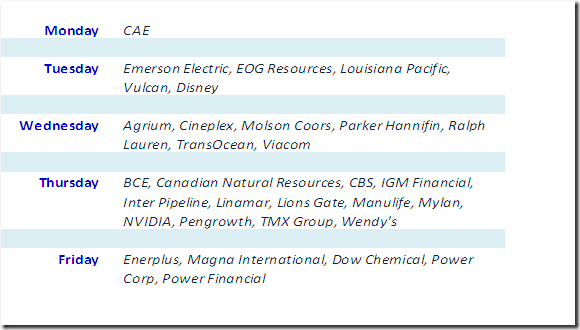
Earnings Reports This Week
Equity Trends
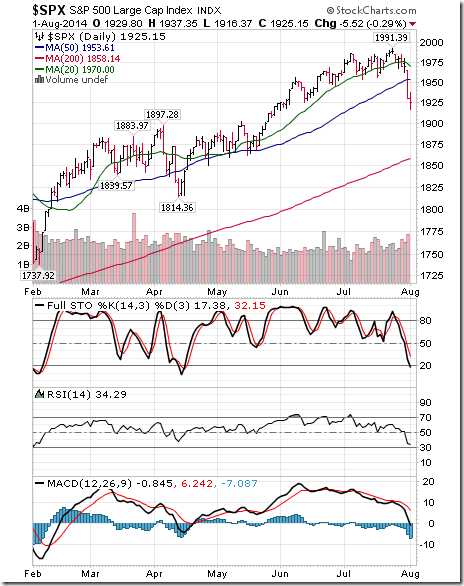
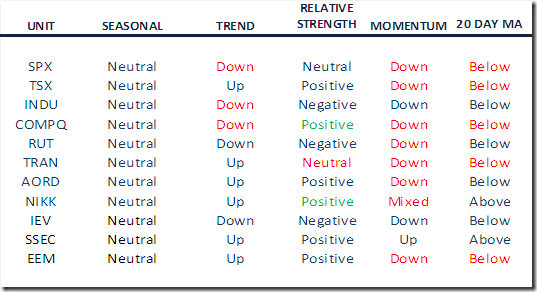
The S&P 500 Index fell 53.19 points (2.69%) last week. Intermediate trend changed from up to down on moves below support at 1,955.59 and 1,925.78. The Index moved below its 20 day moving average. Short term momentum indicators are trending down, but are oversold.
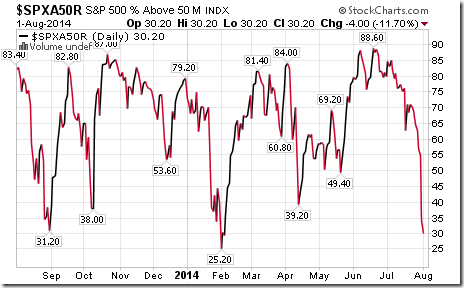
Percent of S&P 500 stocks trading above their 50 day moving average plunged last week to 30.20% from 64.80%. Percent is in an intermediate downtrend, but has yet to show signs of bottoming. Historically, a recovery from below 30% has been the start of an intermediate uptrend. Not there yet, but should be watched closely.
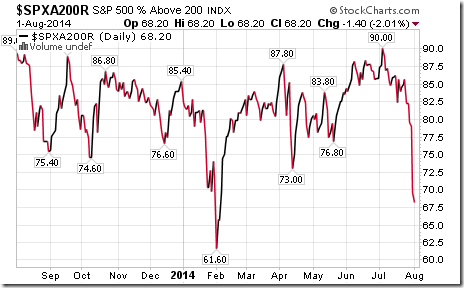
Percent of S&P 500 stocks trading above their 200 day moving average plunged last week to 68.20% from 82.20%. Percent is in an intermediate downtrend and has yet to show signs of bottoming.
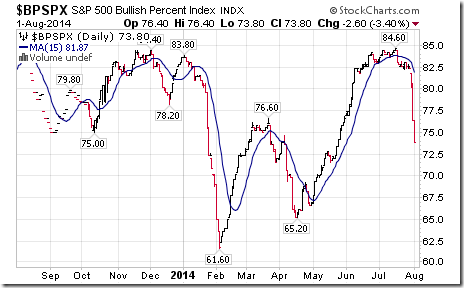
Bullish Percent Index for S&P 500 stocks plunged last week to 73.80% from 82.60% and remains below its 20 day moving average. The Index remains intermediate overbought and trending down.
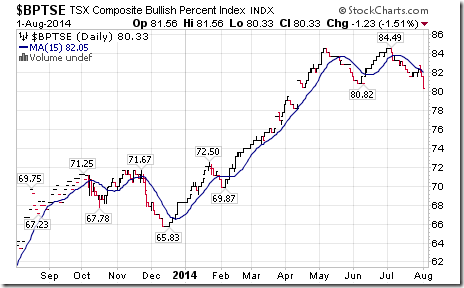
Bullish Percent Index for TSX Composite stocks dropped last week to 80.33% from 81.97% and remained below its 15 day moving average. The Index remains intermediate overbought and trending down.
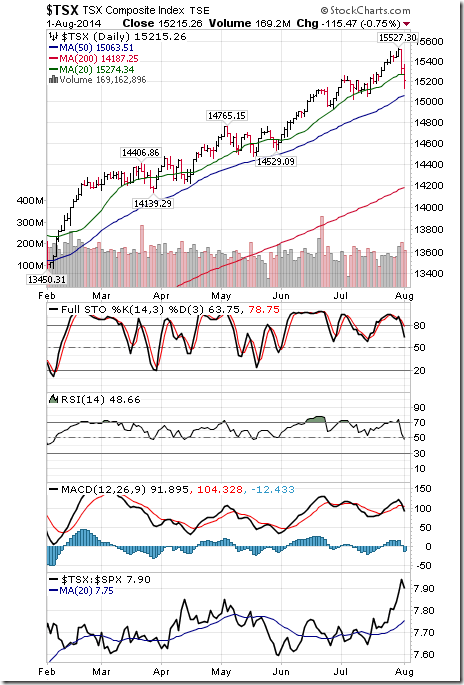
The TSX Composite Index fell 239.78 points (1.55%) last week. Intermediate trend remains up (Score: 1.0). The Index fell below its 20 day moving average on Friday (Score: 0.0). Strength relative to the S&P 500 Index remains positive (Score: 1.0). Technical score based on the above indicators fell to 2.0 from 3.0 out of 3.0. Short term momentum indicators are trending down.
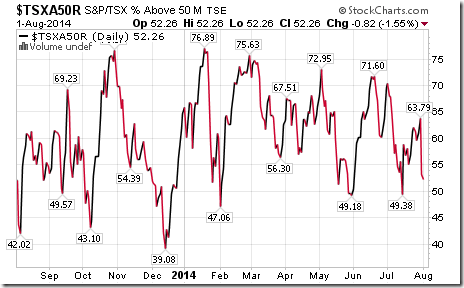
Percent of TSX stocks trading above their 50 day moving average dropped last week to 52.26% from 61.32%. Percent remains intermediate overbought and trending down.
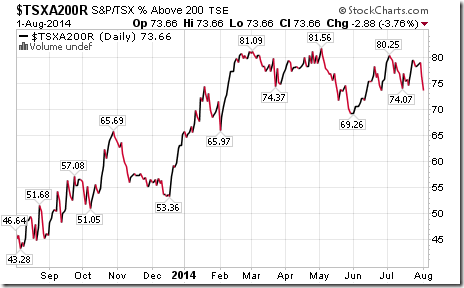
Percent of TSX stocks trading above their 200 day moving average dropped last week to 73.66% from 78.19%. Percent remains intermediate overbought and trending down.
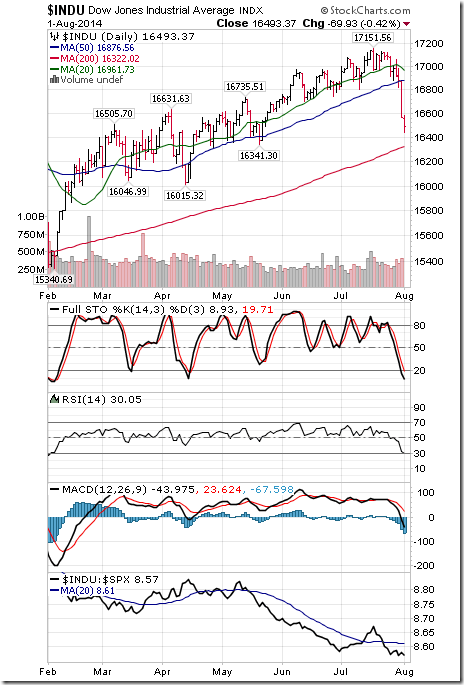
The Dow Jones Industrial Average dropped 467.20 points (2.75%) last week. Intermediate trend changed from up to down on moves below 16,805.38 and 16,703.73. The Average remains below its 20 day moving average and fell below its 50 day moving average. Strength relative to the S&P 500 Index remains negative. Technical score fell to 0.0 from 1.0 out of 3.0. Short term momentum indicators are trending down, but are oversold.
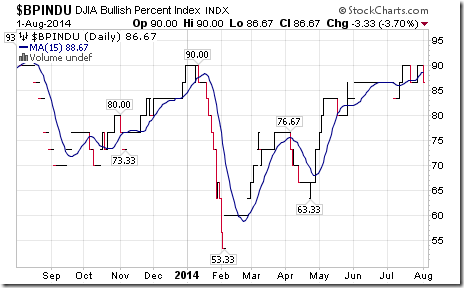
Bullish Percent Index for Dow Jones Industrial Average stocks was unchanged last week at 86.67% and remained below its 15 day moving average. The Index remains intermediate overbought.
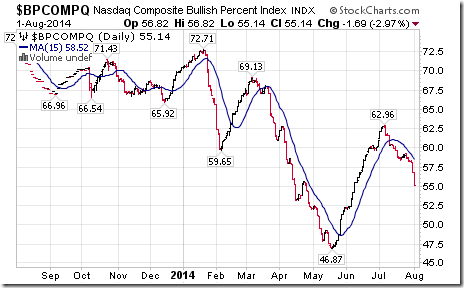
Bullish Percent Index for the NASDAQ Composite Index dropped last week to 55.14% from 58.67% and remained below its 15 day moving average. The Index remains intermediate overbought and is trending down.
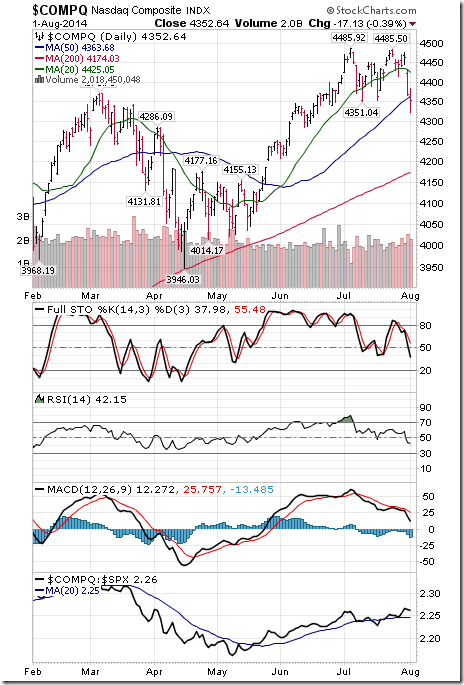
The NASDAQ Composite Index lost 96.92 points (2.18%) last week. Intermediate trend changed from up to down on a move below 4,351.04. The Index fell below its 20 and 50 day moving averages. Strength relative to the S&P 500 Index changed to positive from neutral. Technical score fell to 1.0 from 2.5 out of 3.0. Short term momentum indicators are trending down.
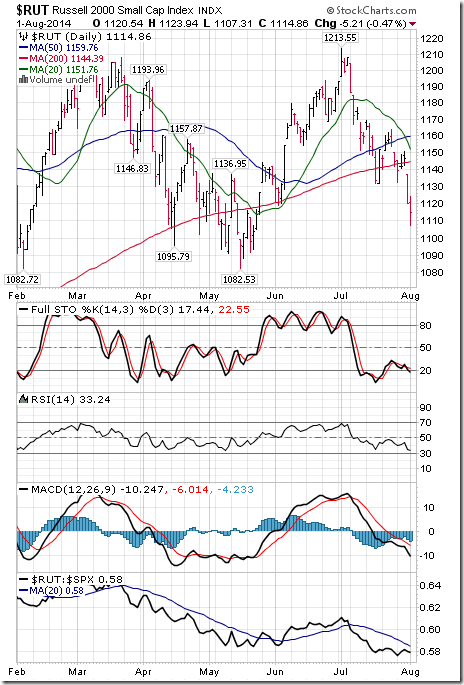
The Russell 2000 Index fell another 37.41 points (3.27%) last week. Intermediate trend remains down. The Index remains below its 20 and 50 day moving averages and fell below its 200 day moving average. Strength relative to the S&P 500 Index remains negative. Technical score remains at 0.0 out of 3.0. Short term momentum indicators are trending down, but are oversold.
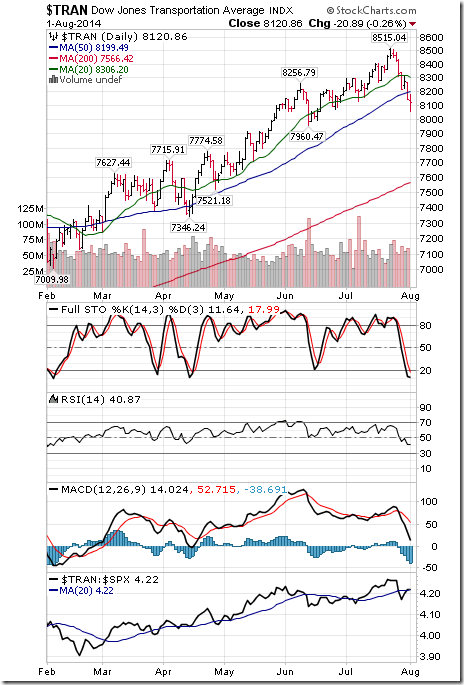
The Dow Jones Transportation Average plunged 307.29 points (3.65%) last week. Intermediate trend remains up. The Average fell below its 20 and 50 day moving averages. Strength relative to the S&P 500 Index changed from positive to neutral. Technical score slipped to 1.5 from 3.0 out of 3.0. Short term momentum indicators are trending down.
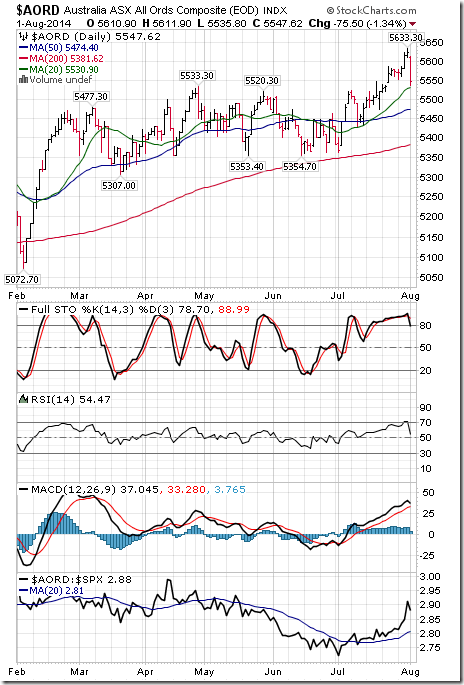
The Australia All Ordinaries Composite Index slipped 26.60 points (0.48%) last week. Intermediate trend remains up. The Index remains above its 20 day moving average. Strength relative to the S&P 500 Index remains positive. Technical score remains at 3.0 out of 3.0. Short term momentum indicators are starting to trend down from an overbought level.
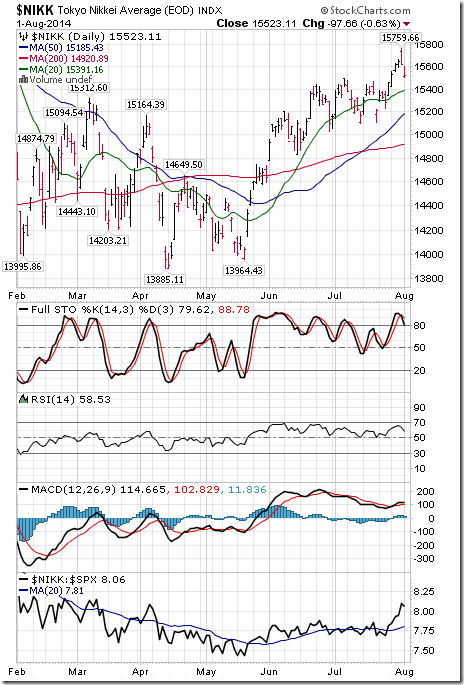
The Nikkei Average added 65.24 points (0.48%) last week. Intermediate trend remains up. The Average remains above its 20 day moving average. Strength relative to the S&P 500 Index changed from neutral to positive. Technical score improved to 3.0 from 2.5 out of 3.0. Short term momentum indicators have started to trend down from overbought levels.
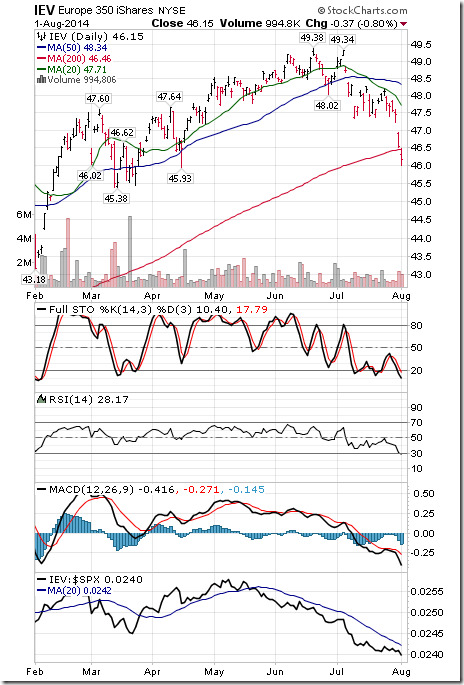
Europe 350 iShares dropped $1.62 (3.39%) last week. Intermediate downtrend was confirmed on a move below $47.34. Units remain below their 20 day moving average. Strength relative to the S&P 500 Index remains negative. Technical score remains at 0.0 out of 3.0. Short term momentum indicators are trending down, but are oversold.
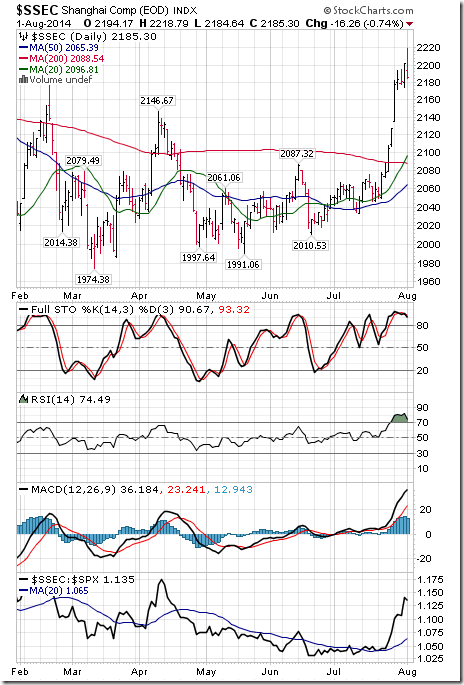
The Shanghai Composite Index added 58.69 points (2.76%) last week. Intermediate trend remains up. The Index remains above its 20 day moving average. Strength relative to the S&P 500 Index remains positive. Technical score remains at 3.0 out of 3.0. Short term momentum indicators are trending up, but are overbought.
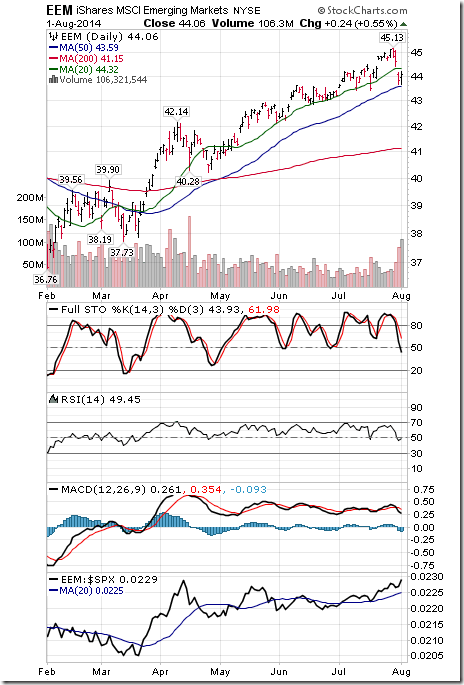
iShares Emerging Markets slipped $0.72 (1.61%) last week. Intermediate trend remains up. Units fell below their 20 day moving average. Strength relative to the S&P 500 Index remains positive. Technical score slipped to 2.0 out of 3.0. Short term momentum indicators are trending down.
Summary of Weekly Seasonal/Technical Parameters for Equity Indices/ETFs
Key:
Seasonal: Positive, Negative or Neutral on a relative basis applying EquityClock.com charts
Trend: Up, Down or Neutral
Strength relative to the S&P 500 Index: Positive, Negative or Neutral
Momentum based on an average of Stochastics, RSI and MACD: Up, Down or Mixed
Twenty Day Moving Average: Above, Below
Green: Upgrade
Red: Downgrade
Currencies
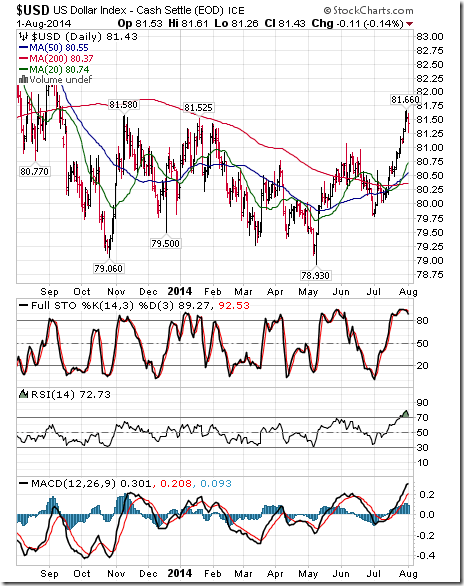
The U.S. Dollar Index gained 0.29 (0.36%) last week. Intermediate trend remains up. The Index remains above its 20, 50 and 200 day moving averages. Short term momentum indicators are trending up, but are overbought.
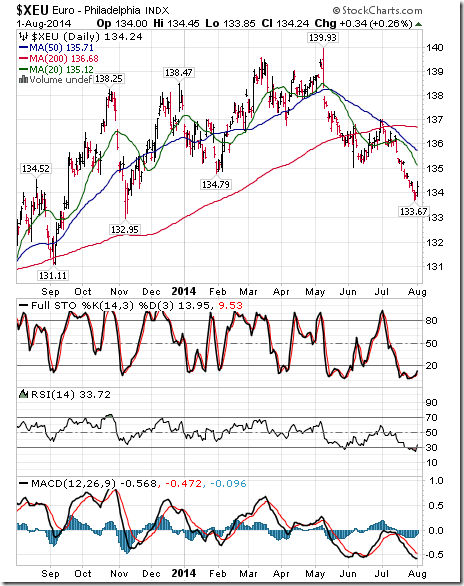
The Euro slipped 0.05 (0.04%) last week. Intermediate trend remains down. The Euro remains below its 20, 50 and 200 day moving average. Short term momentum indicators are trending down, but are oversold.
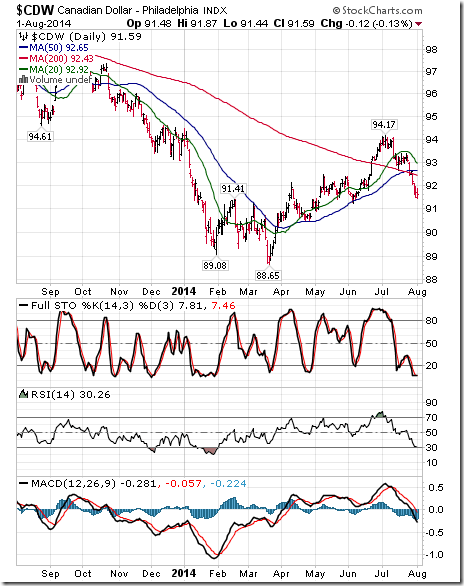
The Canadian Dollar fell US 0.86 cents (0.97%) last week. Intermediate trend remains up. The Canuck Buck remains below its 20, 50 and 200 day moving averages. Short term momentum indicators are trending down and are oversold.
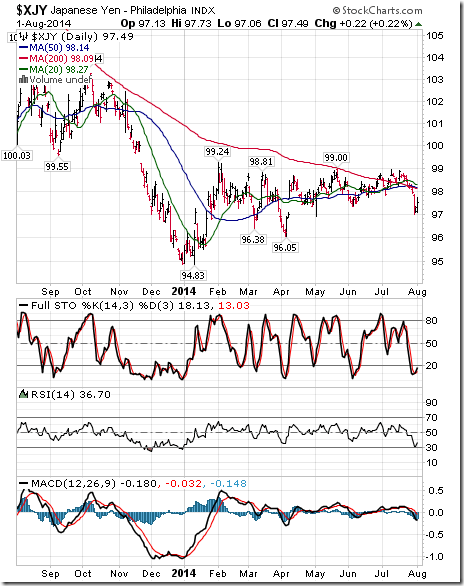
The Japanese Yen fell 0.73 (0.74%) last week. Intermediate trend remains neutral. The Yen remains below its 20, 50 and 200 day moving averages. Short term momentum indicators are trending down and are oversold.
Commodities
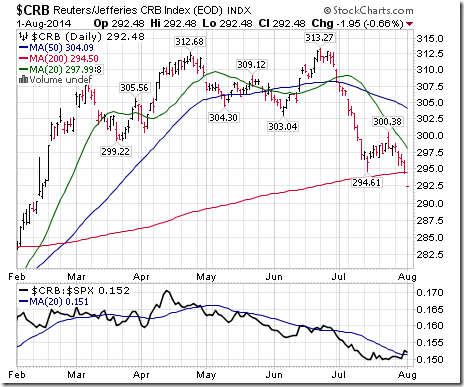
The CRB Index fell 5.86 points (1.96%) last week. Intermediate trend remains down. The Index remains below its 20 day moving average. Strength relative to the S&P 500 Index changed from negative to neutral. Technical score improved to 0.5 from 0.0 out of 3.0.
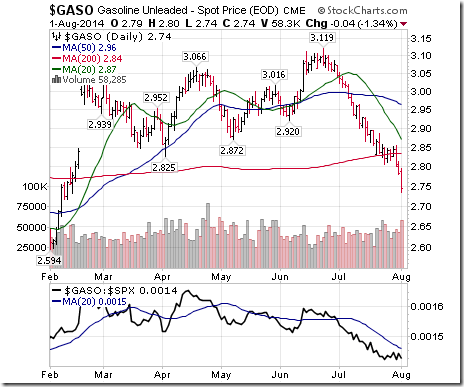
Gasoline dropped another $0.10 per gallon (3.52%) last week. Intermediate trend remains down. Gasoline remains below its 20, 50 and 200 day moving averages. Strength relative to the S&P 500 Index remains negative. Technical score remains at 0.0 out of 3.0
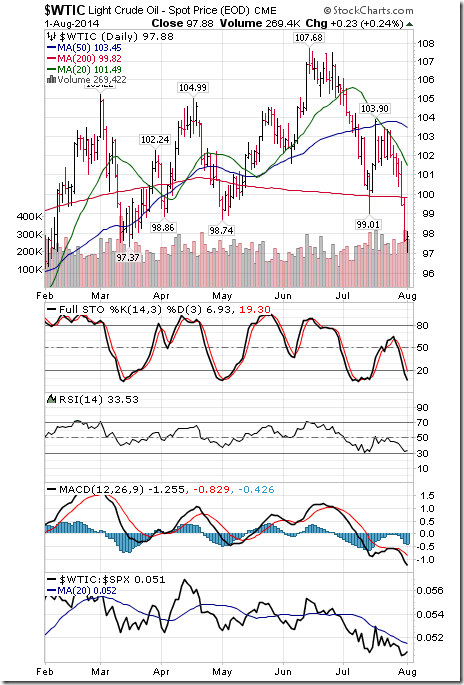
Crude Oil dropped $4.21 per barrel (4.12%) last week. Intermediate trend changed from up to down following a move below $99.01. Crude remains below its 20 and 50 day moving average and fell below its 200 day moving average. Strength relative to the S&P 500 Index remains negative. Technical score dropped to 0.0 from 1.0 out of 3.0. Short term momentum indicators are trending down and are oversold.
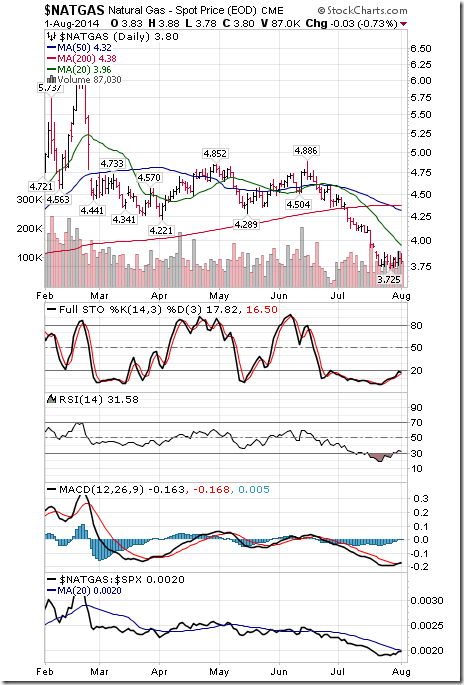
Natural Gas added $0.01 per MBtu (0.26%) last week. Intermediate trend remains down. Gas remains below its 20, 50 and 200 day moving averages. Strength relative to the S&P 500 Index changed from negative to neutral. Technical score improved to 0.5 from 0.0 out of 3.0. Short term momentum indicators are recovering from oversold levels.
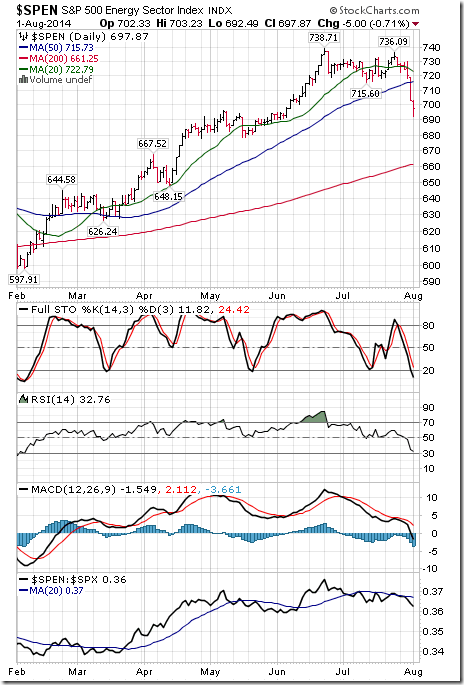
The S&P Energy Index dropped 29.94 points (4.11%) last week. Intermediate trend changed from neutral to down on a move below 715.60. The Index fell below its 20 and 50 day moving averages. Strength relative to the S&P 500 Index changed to negative from neutral. Technical score fell to 0.0 from 2.0 out of 3.0. Short term momentum indicators are trending down.
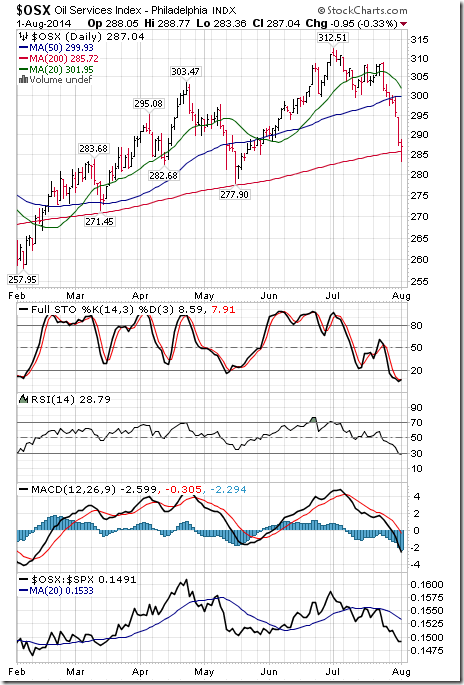
The Philadelphia Oil Services Index plunged 13.76 points (4.57%) last week. Intermediate trend changed from up to down on a move below299.65 when the Index completed a head and shoulders pattern. The Index remains below its 20 day moving average and fell below its 50 day moving average. Strength relative to the S&P 500 Index remains negative. Technical score fell to 0.0 from 1.0 out of 3.0. Short term momentum indicators are trending down and are oversold.
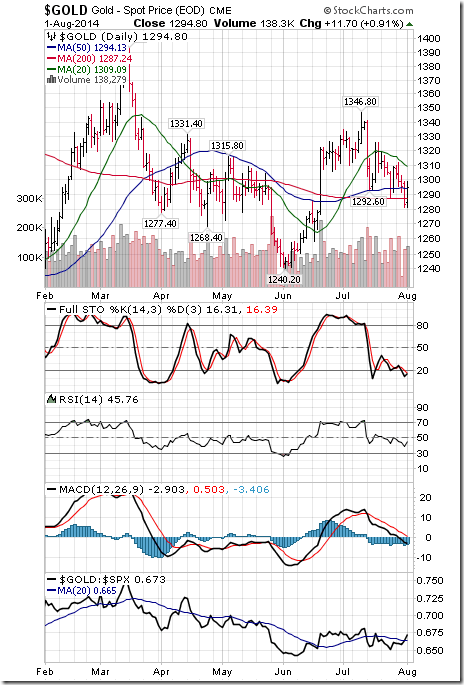
Gold slipped $8.50 per ounce (0.65%) last week. Intermediate trend remains up. Gold remains below its 20 day moving average. Strength relative to the S&P 500 Index changed from neutral to positive. Technical score improved to1.5 from 1.0 out of 3.0. Short term momentum indicators are mixed.
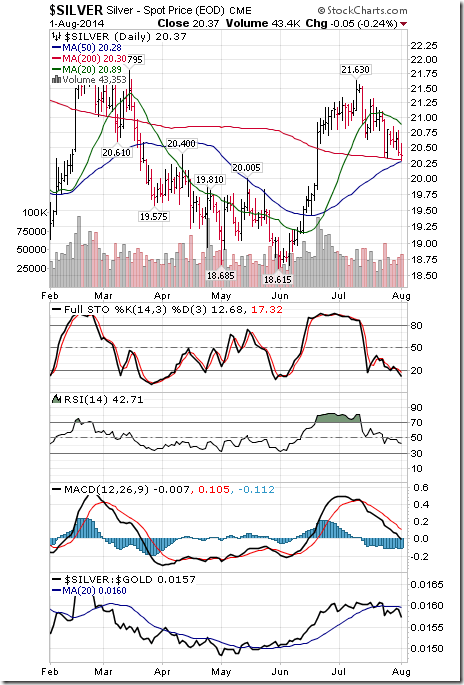
Silver dropped $0.27 per ounce (1.31%) last week. Intermediate trend remains up. Silver remains below its 20 day moving average. Strength relative to the S&P 500 Index remains neutral. Technical score remains at 1.5 out of 3.0. Short term momentum indicators are trending down. Strength relative to Gold remains negative.
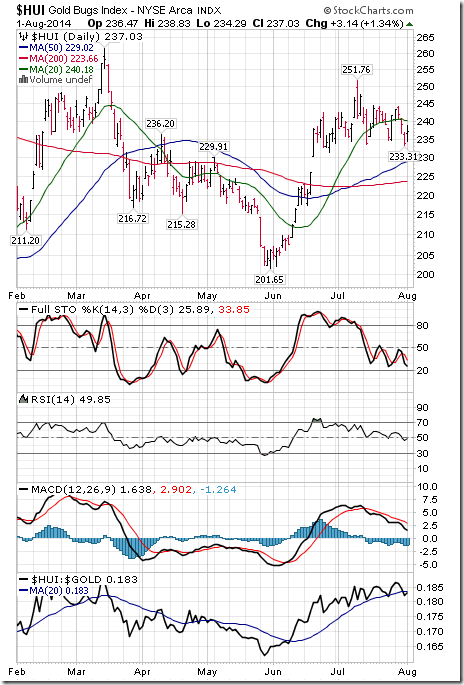
The AMEX Gold Bug Index dropped 4.73 points (1.96%) last week. Intermediate trend remains up. The Index fell below its 20 day moving average. Strength relative to the S&P 500 Index changed from positive to neutral. Technical score slipped to 1.5 from 3.0 out of 3.0. Short term momentum indicators are trending down.
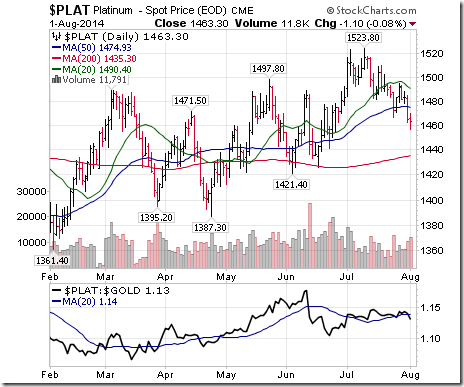
Platinum dropped $15.30 per ounce (1.03%) last week. Intermediate trend remains up. PLAT remains below its 20 day moving average. Strength relative to S&P 500 and Gold is neutral.
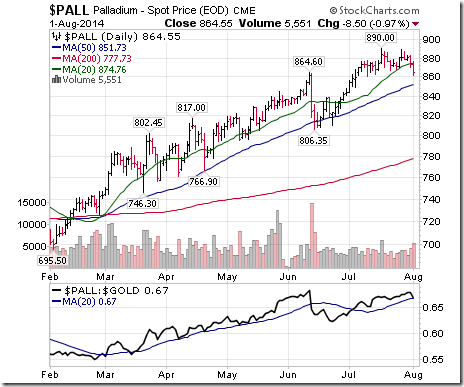
Palladium dropped $15.25 per ounce (1.73%) last week. Trend remains up. PALL fell below their 20 day moving average. Strength relative to the S&P 500 and Gold is neutral.
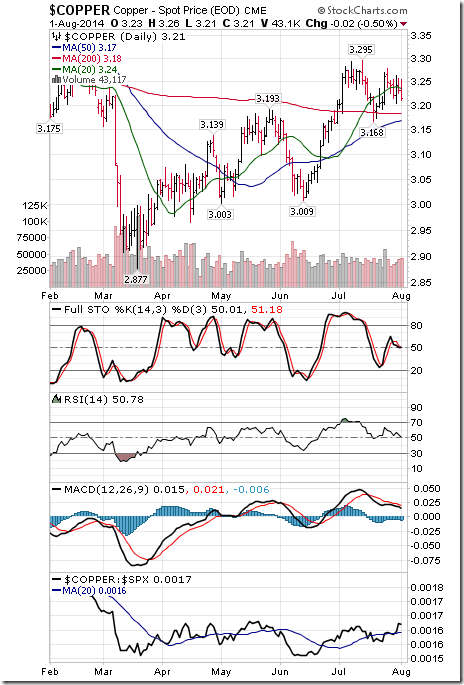
Copper dropped $0.03 per ounce (0.93%) last week. Intermediate trend remains up. Copper fell below its 20 day moving average. Strength relative to the S&P 500 Index changed from neutral to positive. Technical score fell to 2.0 from 2.5 out of 3.0. Short term momentum indicators are mixed.
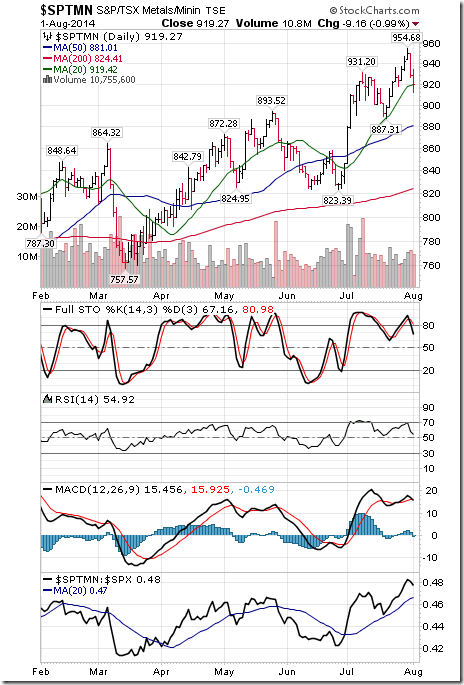
The TSX Metals & Mining Index slipped 4.75 points (0.51%) last week. Intermediate trend remains up. The Index fell below its 20 day moving average. Strength relative to the S&P 500 Index remains positive. Technical score dropped to 2.0 from 3.0 out of 3.0. Short term momentum indicators are mixed.
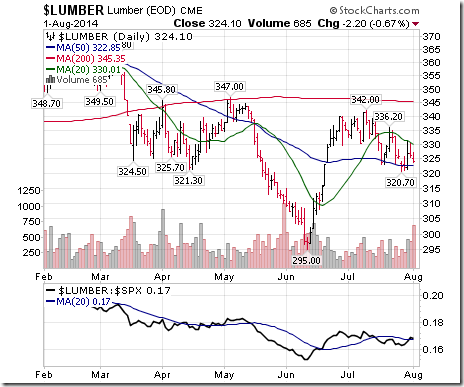
Lumber slipped $1.40 (0.43%) last week. Trend remains down. Lumber remains below its 20 day moving average. Strength relative to the S&P 500 Index changed from negative to neutral.
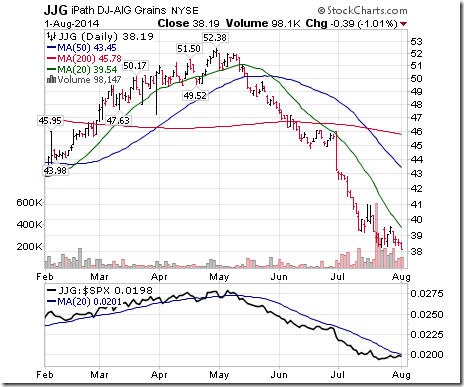
The Grain ETN dropped another $0.87 (2.23%) last week. Trend remains down. Units remain below their 20 day moving average. Strength relative to the S&P 500 Index changed from negative to neutral.
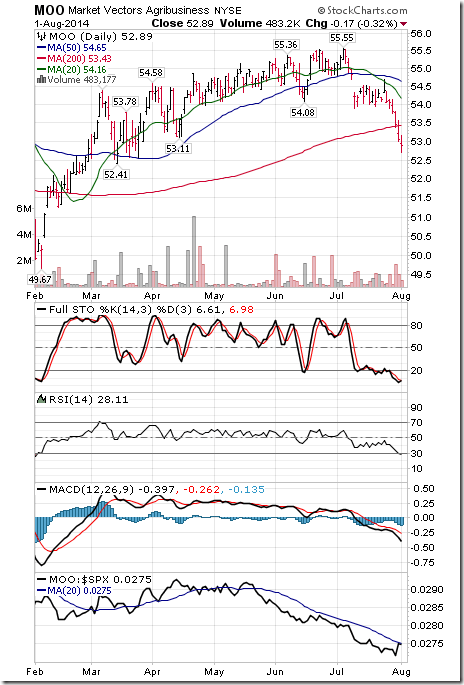
The Agriculture ETF fell $1.20 (2.28%) last week. Intermediate trend remains down. Units remain below their 20 day moving average. Strength relative to the S&P 500 Index remains negative. Technical score remains at 0.0 out of 3.0. Short term momentum indicators are trending down and are oversold.
Interest Rates
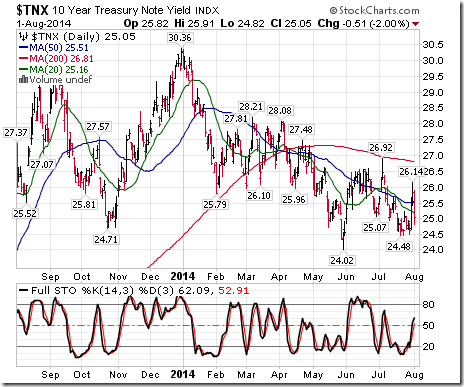
The yield on 10 year Treasuries added 3.6 basis points (1.46%) last week. Trend remains neutral. Yield remains below its 20 day moving average. Short term momentum indicators are trending up.
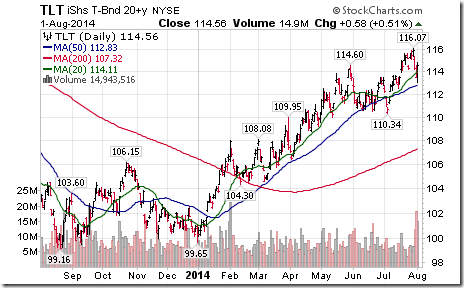
Conversely, price of the long term Treasury ETF flipped $1.11 (0.96%) last week. Intermediate trend remains up. Units remain above their 20 day moving average.
Other Issues
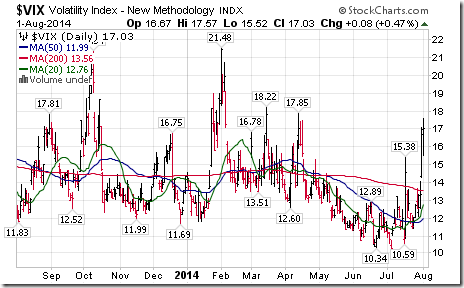
The VIX Index spiked 4.34 (34.20%) last week. The Index moved above its 20 day moving average. ‘Tis the season!
Economic news this week is expected to confirm slow but steady growth in the U.S.
The second quarter report season is winding down in the U.S. and gearing up in Canada. Responses to reports last week were negative unless earnings and revenues were a ‘blow out”.
Short and intermediate technical indicators for most equity indices and sectors are in a downtrend. However, some of the indicators (e.g. Percent of S&P 500 stocks trading above their 50 day moving average) already have reached oversold levels, but have yet to show signs of bottoming. Implication: A large part of the current intermediate correction probably has already been recorded.
Seasonal influences on equity markets in the month of August are mixed. The month has a history of recording a volatility spike with underperformance by economic sensitive stocks. History is repeating. Gold and gold equities normally respond on the upside with greater volatility
International events continue to impact equity markets. Conflicts in Palestine, Ukraine and Libya remain a focus. Deteriorating economic news from Europe is a growing concern.
The Bottom Line
Defensive strategies are recommended. Exceptions exist (e.g. precious metals and precious metals equities).
StockTwits Released During Trading on Friday
(Available @equityclock. Over 1,400 investors already are connected)
Tweets are provided in chronologic order
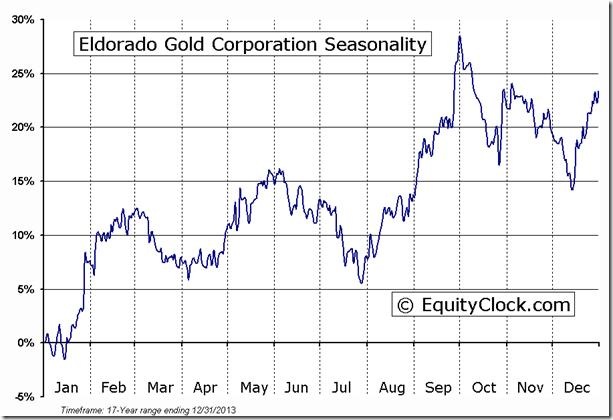
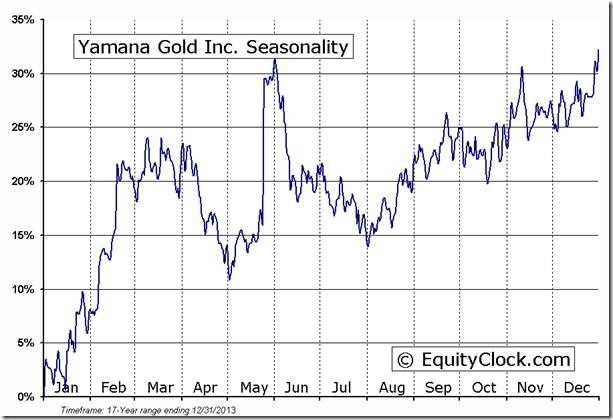
Selected Cdn. gold stocks are breaking resistance. Notable are $ELD and $YRI. Add to monitored list.
Nice breakout by $ELD above $8.65 Cdn. Favourable seasonal influences are just starting
Nice breakout by $YRI above $9.57. Favourable seasonal influences are just starting
Energy stocks on both sides of the border are breaking support: $CVX and $PXD in the U.S. and $ERF and $CNQ in Canada.
Technical action by S&P 500 stocks remains bearish. As of 10:30 AM another 14 stocks broke support and one ($EXPE) broke resistance.
More weakness in Cdn. energy! $SPTEN broke support at 314.22 to set a new downtrend.
From 10:30 to 12:30 another 7 S&P stocks broke support. Notable was $ORCL, a leader in technology.
Special Free Services available through www.equityclock.com
Equityclock.com is offering free access to a data base showing seasonal studies on individual stocks and sectors. The data base holds seasonality studies on over 1000 big and moderate cap securities and indices. To login, simply go to http://www.equityclock.com/charts/
Following are examples:
Disclaimer: Comments, charts and opinions offered in this report by www.timingthemarket.ca and www.equityclock.com are for information only. They should not be considered as advice to purchase or to sell mentioned securities. Data offered in this report is believed to be accurate, but is not guaranteed. Don and Jon Vialoux are Research Analysts with Horizons ETFs Management (Canada) Inc. All of the views expressed herein are the personal views of the authors and are not necessarily the views of Horizons ETFs Management (Canada) Inc., although any of the recommendations found herein may be reflected in positions or transactions in the various client portfolios managed by Horizons ETFs Management (Canada) Inc.
Individual equities mentioned in StockTwits are not held personally or in HAC.
Horizons Seasonal Rotation ETF HAC August 5th 2014
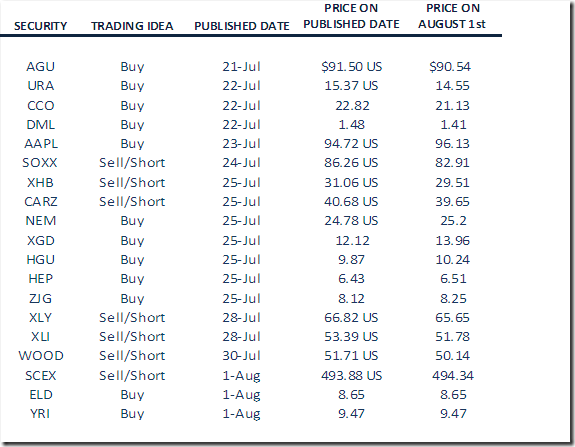
Monitored Technical/Seasonal Trade Ideas


