Pre-opening Comments for Friday August 1st
(Editor’s Note: Next Tech Talk report is available on Tuesday August 5th)
U.S. equity index futures were lower this morning. S&P 500 futures were down 2 points in pre-opening trade.
Index futures recovered following release of the July employment report. Consensus for July Non-farm Payrolls was 230,000 versus an upwardly revised 298,000 in June. Actual was 209,000. Consensus for July Private Non-farm Payrolls was 223,000 versus 262,000 in June. Actual was 198,000. Consensus for the July Unemployment Rate was unchanged at 6.1%. Actual was an increase of 0.1 to 6.2%. Consensus for July Hourly Earnings was an increase of 0.2%. Actual was unchanged.
Bed Bath & Beyond dropped $1.79 to $61.50 after Oppenheimer downgraded the stock from Outperform to Market Perform. Target is $69.
Expedia added $2.18 to $81.60 after Raymond James upgraded the stock from Market Perform to Outperform
Monsanto eased $0.12 to $112.97 after BGC Partners downgraded the stock from Buy to Hold.
TransCanada (TRP $54.70 Cdn) is expected to open lower after TD Securities downgraded the stock from Buy to Hold.
Gildan Activewear (GIL $63.89 Cdn.) is expected to open higher after Stifel Nicolaus upgraded the stock from Hold to Buy.
EquityClock.com’s Daily Market Comment
Following is a link:
http://www.equityclock.com/2014/07/31/stock-market-outlook-for-august-1-2014/
Interesting Charts
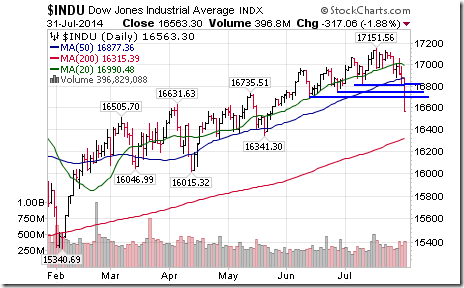
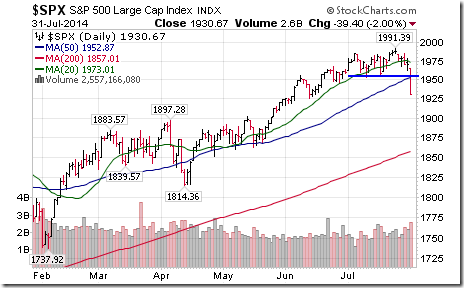
A major draw down by U.S. equity markets! The Dow Jones Industrial Average broke below three short term support levels and its 50 day moving average. Note that the DJIA closed below its close on May 23rd. Did “Sell in May and Go Away” work after all?
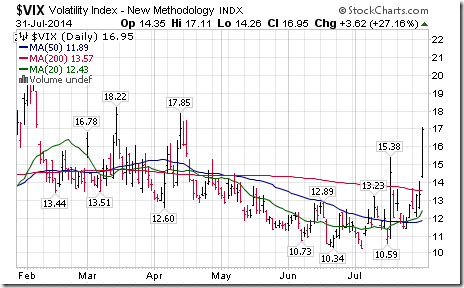
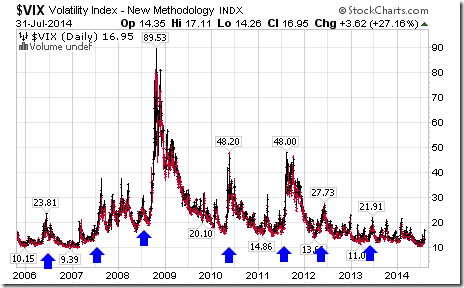
The VIX Index spiked. ‘Tis the season!
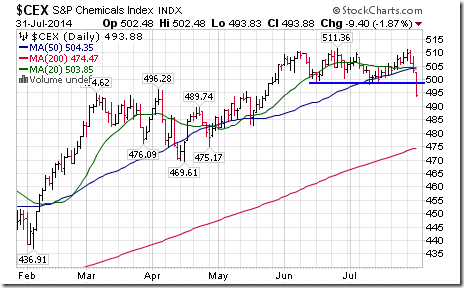
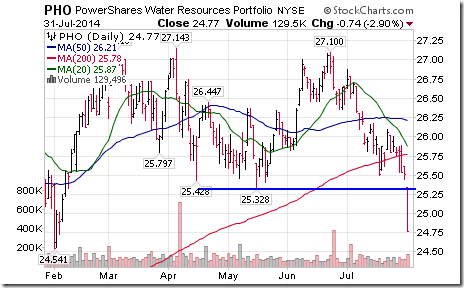
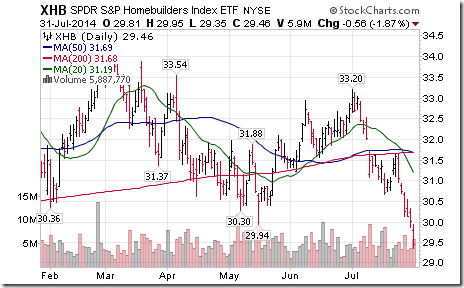
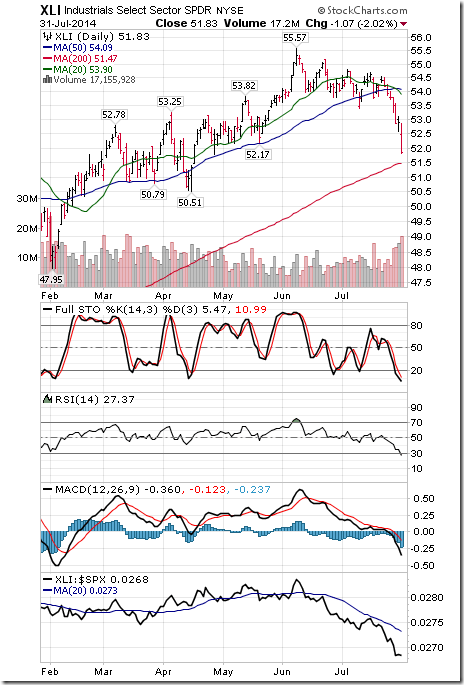
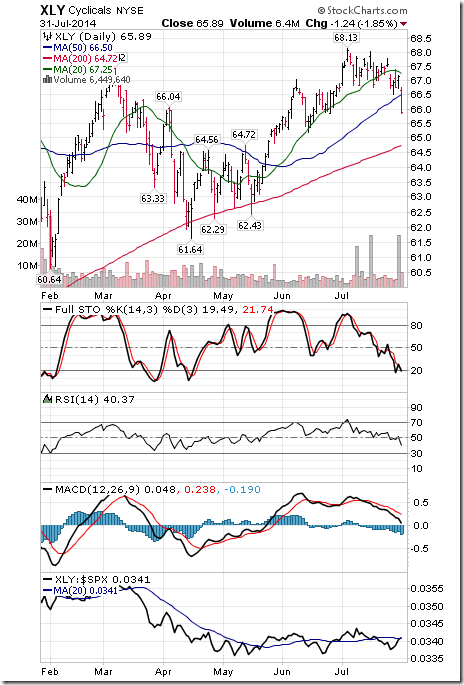
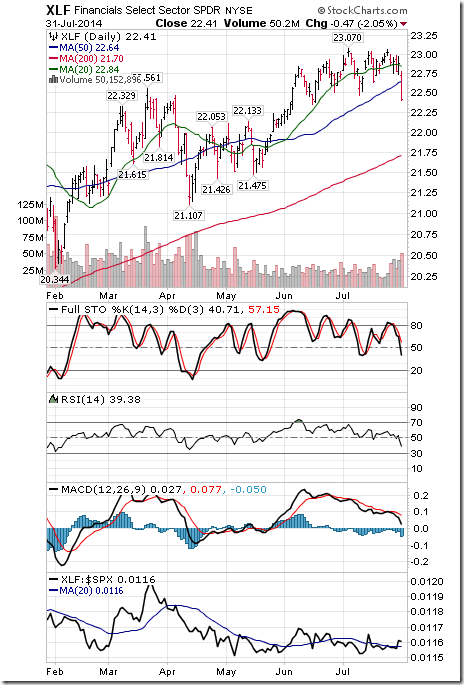
Economic sensitive sectors were particularly hard hit.
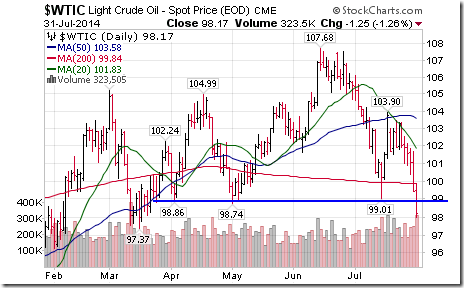
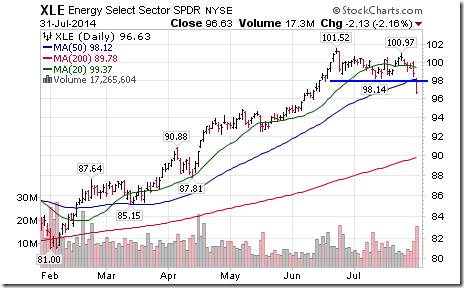
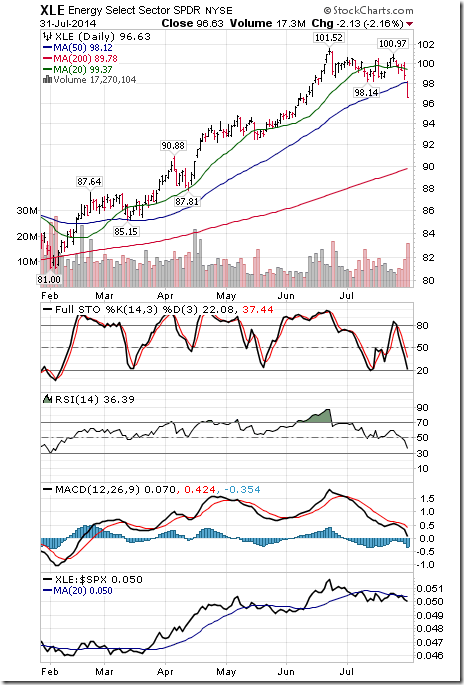
A breakdown by crude oil prices prompted weakness in the energy sector.
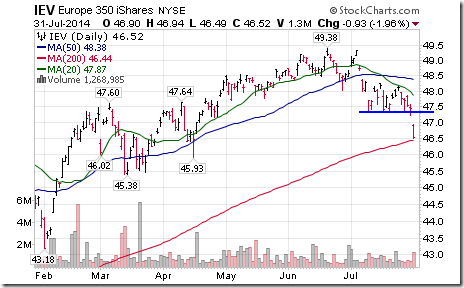
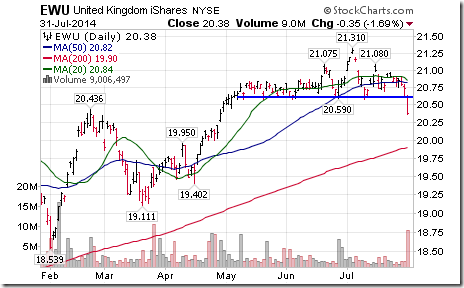
European equity markets led international equity markets on the downside.
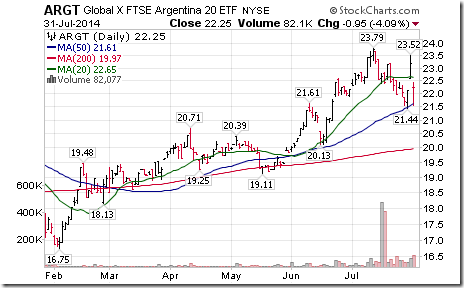
Ironically, weakness in Argentina equities was not a significant technical event despite extensive media comments on Argentina’s debt default.
StockTwits released yesterday through EquityClock
(Charts have been updated to yesterday’s close)
This morning the S&P 500 has broken support at 1952.86 and its 50 day moving average.
Substantial bearish action by S&P 500 stocks at 10:30 AM! 29 S&P 500 stocks broke support and 4 broke resistance.
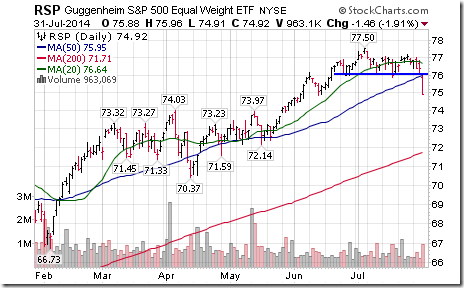
The equally weighted S&P 500 ETF completed a modified Head & Shoulders pattern this morning.
Energy stocks on both sides of the border have started to break support. U.S. stocks included $EOG, $MUR, $NE, $HP
$XLE (S&P Energy) completed a double top pattern on a break below $98.14
$EWU (UK iShares) completed a classic Head & Shoulders this morning
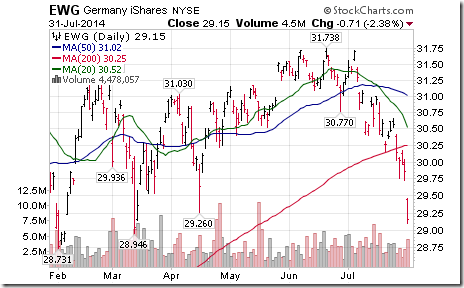
European equities are leading equity markets lower. $EWG already is down 8% from its recent high.
$VIX is up 20.71% to 16.09 today. Happens almost every summer beginning in July
Another 17 S&P 500 stocks broke support from 10:30 to 12:00. Notable were oil service stocks: $HAL, $RIG, $WPX
Technical Action by Individual Equities
By the close, 58 S&P 500 stocks had broken support and four stocks had broken resistance.
No TSX 60 stocks broke support or resistance.
Jon Vialoux on BNN Yesterday
Following is a link to top picks:
http://www.bnn.ca/Video/player.aspx?vid=409593
http://www.bnn.ca/Video/player.aspx?vid=409602
http://www.bnn.ca/Video/player.aspx?vid=409601
http://www.bnn.ca/Video/player.aspx?vid=409605
http://www.bnn.ca/Video/player.aspx?vid=409609
http://www.bnn.ca/Video/player.aspx?vid=409618
http://www.bnn.ca/Video/player.aspx?vid=409613
http://www.bnn.ca/Video/player.aspx?vid=409624
FP Trading Desk Headline
FP Trading Desk headline reads, “Five mega-trends that will shape the future of investing”. Following is a link:
Weekly SPDR Technical Review
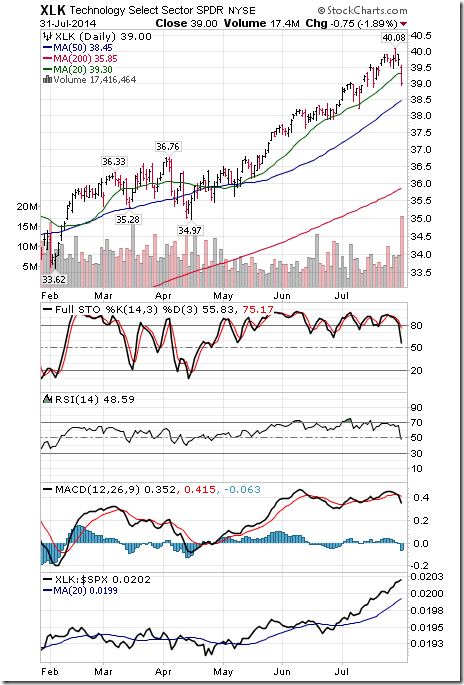
Technology
· Intermediate trend remains up (Score: 1.0)
· Units fell below their 20 day moving average yesterday (Score: 0.0)
· Strength relative to the S&P 500 Index remains positive (Score: 1.0)
· Technical score based on the above parameters slipped to 2.0 out of 3.0
· Short term momentum indicators are trending down.
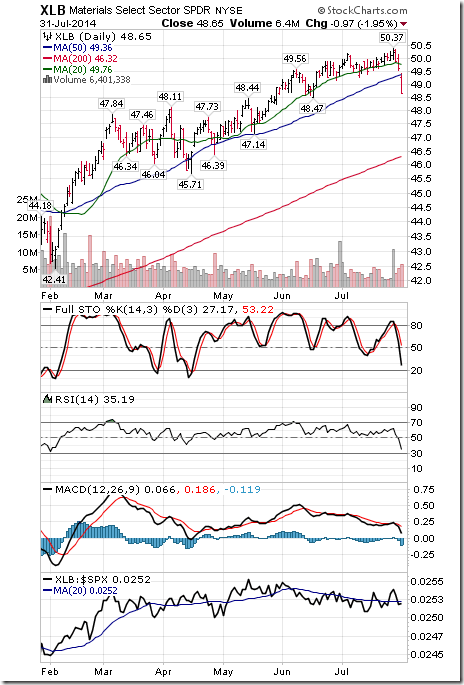
Materials
· Intermediate trend changed yesterday from up to neutral on a move below $49.27
· Units fell below their 20 day moving average
· Strength relative to the S&P 500 Index remains neutral
· Technical score fell to 1.0 from 2.5 out of 3.0
· Short term momentum indicators are trending down.
Industrials
· Intermediate trend remains down
· Units remain below their 20 day moving average
· Strength relative to the S&P 500 Index remains negative
· Technical score remains at 0.0 out of 3.0.
· Short term momentum indicators are trending down, but are oversold
Consumer Discretionary
· Intermediate trend changed from up to down on a move below $66.81
· Units fell below their 20 day moving average
· Strength relative to the S&P 500 Index remains neutral
· Technical score fell to 0.5 from 2.5 out of 3.0
· Short term momentum indicators are trending down.
Financials
· Intermediate trend changed from up to down on a close below $22.46 yesterday.
· Units moved below their 20 day moving average
· Strength relative to the S&P 500 Index remained neutral
· Technical score fell to 0.5 from 2.5 out of 3.0
· Short term momentum indicators are trending down.
Energy
· Intermediate trend changed from up to down on a move below $98.14
· Units remain below their 20 day moving average
· Strength relative to the S&P 500 Index remains neutral
· Technical score changed from 0.5 from 1.5 out of 3.0.
· Short term momentum indicators are trending down.
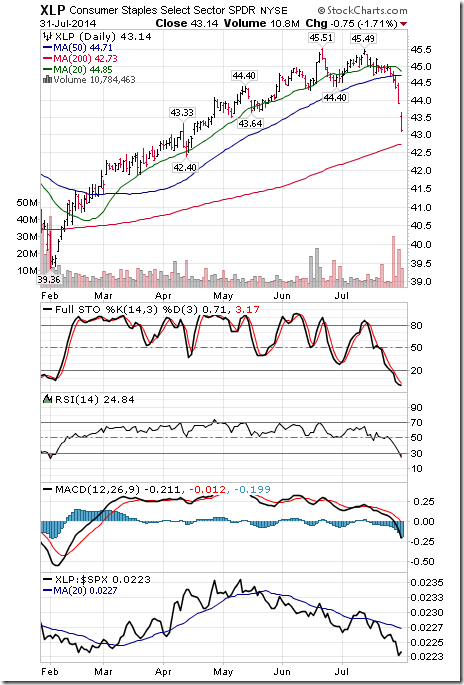
Consumer Staples
· Intermediate trend changed from up to down on a move below $44.40
· Units remain below their 20 day moving average
· Strength relative to the S&P 500 Index remains negative
· Technical score fell to 0.0 from 1.0 out of 3.0.
· Short term momentum indicators are trending down, but are oversold.
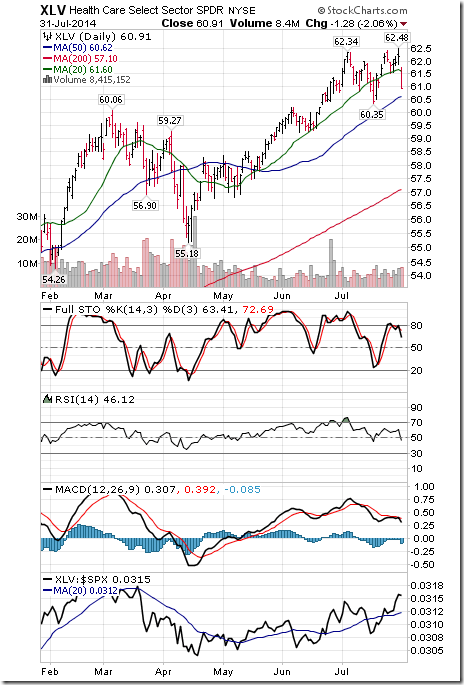
Health Care
· Intermediate trend remains up.
· Units fell below their 20 day moving average
· Strength relative to the S&P 500 Index improved to positive to neutral
· Technical score fell to 1.5 from 2.5 out of 3.0
· Short term momentum indicators remain mixed.
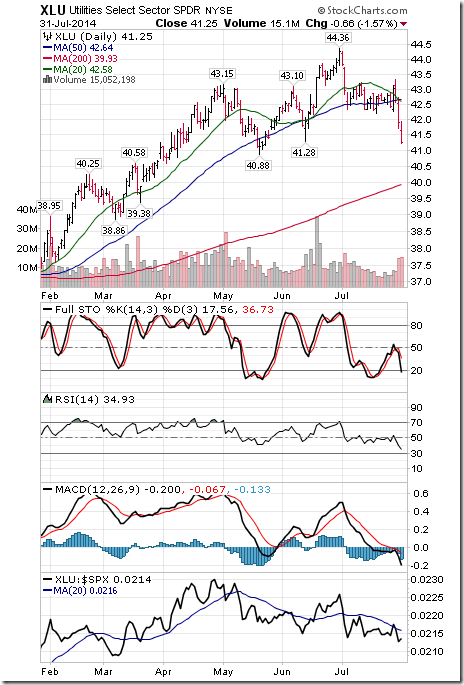
Utilities
· Intermediate trend changed from up to down on a move below $42.31
· Units remain below their 20 day moving average.
· Strength relative to the S&P 500 Index remains negative
· Technical score fell to 0.0 from 1.0 out of 3.0.
· Short term momentum indicators are trending down.
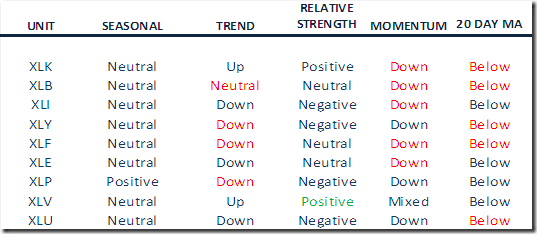
Summary of Weekly Seasonal/Technical Parameters for SPDRs
Key:
Seasonal: Positive, Negative or Neutral on a relative basis applying EquityClock.com charts
Trend: Up, Down or Neutral
Strength relative to the S&P 500 Index: Positive, Negative or Neutral
Momentum based on an average of Stochastics, RSI and MACD: Up, Down or Mixed
Twenty Day Moving Average: Above, Below
Green: Upgrade from last week
Red: Downgrade from last week
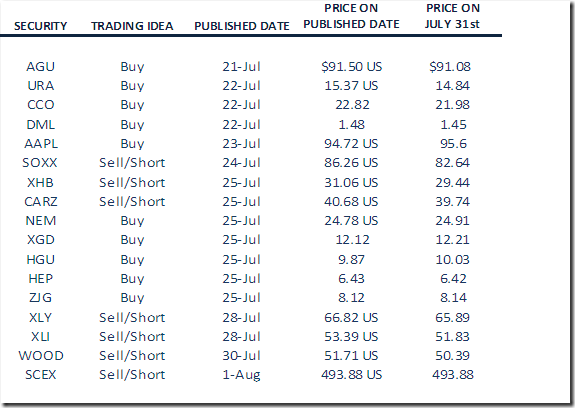
Monitored Technical/Seasonal Trade Ideas
Special Free Services available through www.equityclock.com
Equityclock.com is offering free access to a data base showing seasonal studies on individual stocks and sectors. The data base holds seasonality studies on over 1000 big and moderate cap securities and indices. To login, simply go to http://www.equityclock.com/charts/
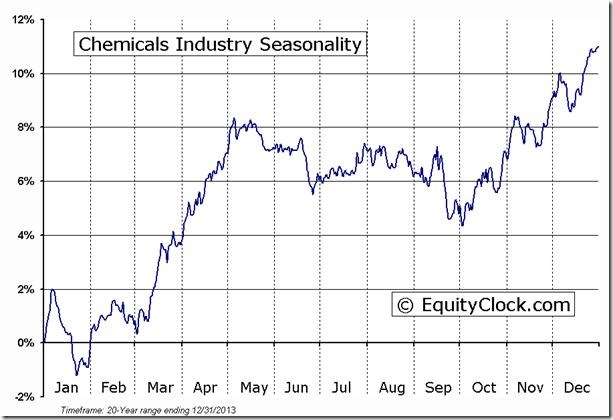
Following is an example
S5CHEM Index Relative to the S&P 500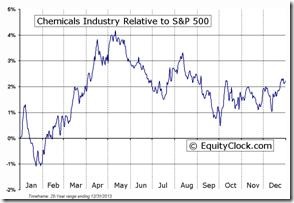 |
S5CHEM Index Relative to the Sector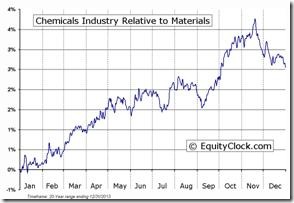 |
Editor’s Note: As noted above, the sector broke support yesterday just as entering its period of seasonal weakness on a real and relative basis. Accordingly, the sector is added to the Monitored list with $CEX at 493.88
Disclaimer: Comments, charts and opinions offered in this report by www.timingthemarket.ca and www.equityclock.com are for information only. They should not be considered as advice to purchase or to sell mentioned securities. Data offered in this report is believed to be accurate, but is not guaranteed. Don and Jon Vialoux are Research Analysts with Horizons ETFs Management (Canada) Inc. All of the views expressed herein are the personal views of the authors and are not necessarily the views of Horizons ETFs Management (Canada) Inc., although any of the recommendations found herein may be reflected in positions or transactions in the various client portfolios managed by Horizons ETFs Management (Canada) Inc.
Individual equities mentioned in StockTwits are not held personally or in HAC.
Horizons Seasonal Rotation ETF HAC July 31st 2014


