Jon Vialoux is scheduled to appear on BNN Television’s Market Call today at 1:00 PM EDT
Pre-opening Comments for Thursday July 31st
U.S. equity index futures were lower this morning. S&P 500 futures were down 12 points in pre-opening trade. Futures are responding to news that Argentina failed to reach a deal to avert default on its debt. Look for the VIX Index to spike at the opening.
Futures weakened further following release of the Weekly Jobless Claims report. Consensus was 300,000 versus a downwardly revised 279,000 last week. Actual was 302,000.
The Canadian Dollar was virtually unchanged following release of Canada’s GDP in May. Consensus was an increase of 0.4% versus a gain of 0.1% in April. Actual was an increase of 0.4%.
Franklin Resources (BEN $56.07) is expected to open lower after Citigroup downgraded the stock from Buy to Neutral.
Kraft Foods dropped$1.44 to $55.80 after reporting lower than consensus second quarter results. In addition, Deutsche Bank downgraded the stock from Buy to Hold. Target is $59.
Lululemon added $0.05 to $39.50 after Susquehanna initiated coverage with a Positive rating. Target is $49.
Qualcomm fell $0.84 to $75.20 after Bernstein downgraded the stock from Outperform to Market Perform. Target is $80.
Whole Foods dropped $2.01 to $37.10 after JP Morgan downgraded the stock from Overweight to Neutral. Target price is $38.
Cliffs Natural Resources (CLF $17.10) is expected to open higher after Bernstein upgraded the stock from Underperform to Market Perform. Target is $16.
EquityClock.com’s Daily Market Comment
Following is a link:
http://www.equityclock.com/2014/07/30/stock-market-outlook-for-july-31-2014/
Interesting Charts
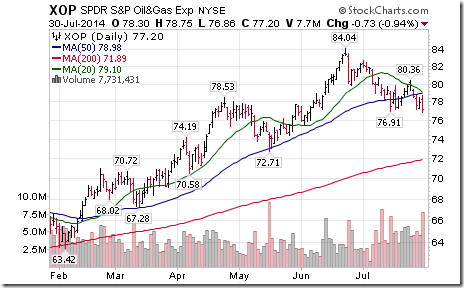
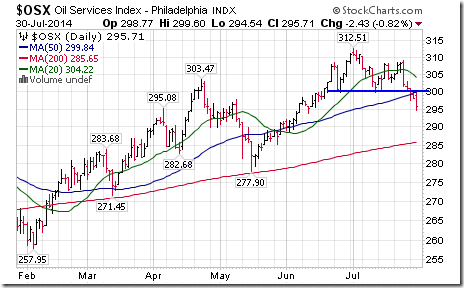
The Energy sector is under technical pressure. Favourable seasonal influences at this time of year are not happening. XOP on our Monitored list has been deleted at a loss of 3.20%
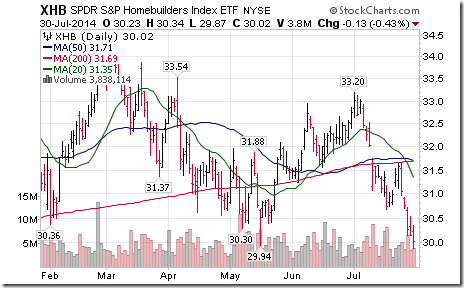
Home builder equities and related ETFs remain under significant technical pressure with many hitting new lows. XHB remains on the Monitored list as a Sell/Short.
Seasonal Influences in the Month of August
August tends to be a mixed month for broadly based U.S. equity indices. During the past 62 years, August has been the fourth best performing month of the year for the Dow Jones Industrial Average and sixth best performing month for the S&P 500 Index. Performance for the NASDAQ Composite Index and TSX Composite Index has been less promising. During the past 40 years, August has been the 11th best (i.e. second worst) performing month and during the past 37 years, August has been the 10th best (i.e. third worst) performing month.
Best performing sectors in August during the past 22 years were Utilities. All other sectors on average reported a loss in the month. Worst performing sectors were Telecom, Materials, Consumer Discretionary and Industrials.
Best performing sub-sectors in August were Biotech, Agriculture and Gold.
StockTwits Released Yesterday
(Using the EquityClock handle)
Charts have been updated to yesterday’s close
Technicals by S&P 500 stocks at 10:45 remained bearish. 6 broke resistance and 21 broke support. Staples, Industrials, Finance hit most.
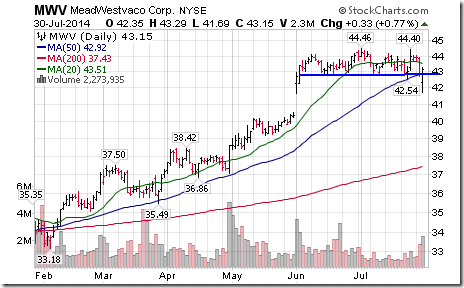
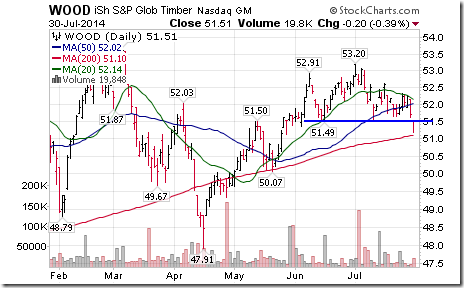
$MWV completed a Head & Shoulders pattern. Ditto for $WOOD! ‘Tis the season!
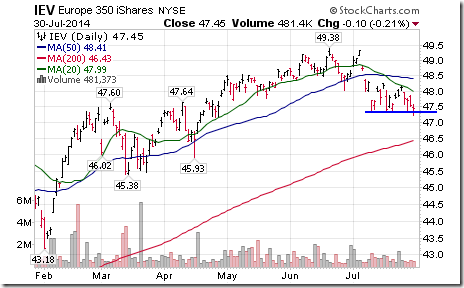
$IEV broke support at $47.34 confirming an intermediate downtrend by big cap European equities.
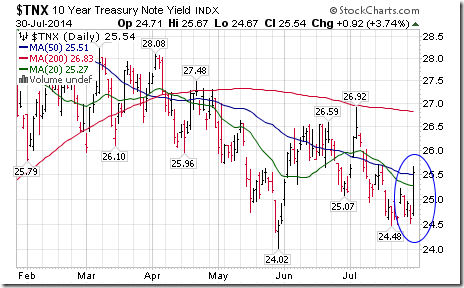
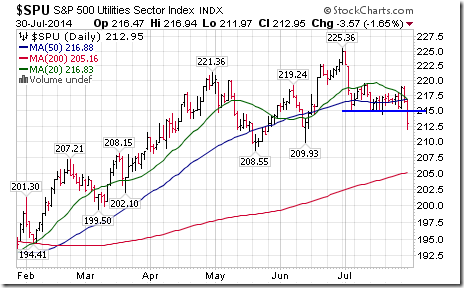
Another 14 S&P 500 stocks broke support since 10:45. 8 of the breakdowns occurred in Utilities following an 8 basis point increase in $TNX
Editor’s Note: Another 3 S&P Utilities broke support thereafter. The S&P Utilities Index broke support and set a new intermediate downtrend.
Technical Action by Individual Equities
Technical action by S&P 500 stocks was significantly bearish yesterday. Six stocks broke resistance and 39 broke support.
Among TSX 60 stocks, Valeant Pharmaceutical and CGI Group broke above resistance and Penn West broke support (on news of accounting irregularities)
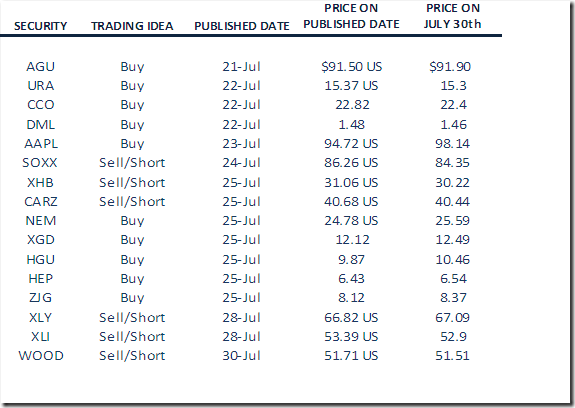
Monitored Technical/Seasonal Trade Ideas
Special Free Services available through www.equityclock.com
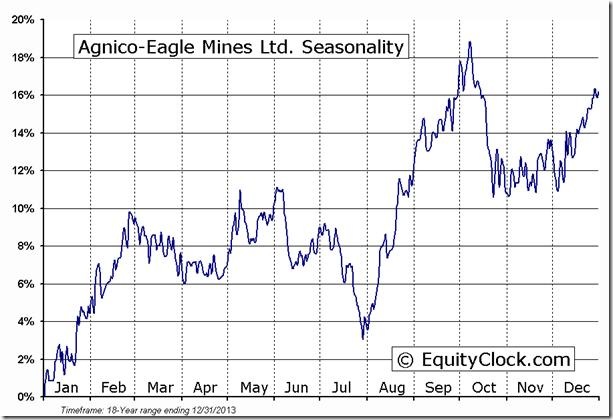
Equityclock.com is offering free access to a data base showing seasonal studies on individual stocks and sectors. The data base holds seasonality studies on over 1000 big and moderate cap securities and indices. To login, simply go to http://www.equityclock.com/charts/
Following is an example:
AEM.TO Relative to the S&P 500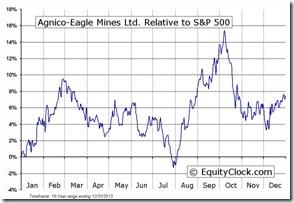 |
AEM.TO Relative to the Sector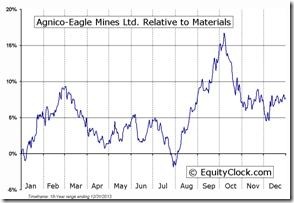 |
Disclaimer: Comments, charts and opinions offered in this report by www.timingthemarket.ca and www.equityclock.com are for information only. They should not be considered as advice to purchase or to sell mentioned securities. Data offered in this report is believed to be accurate, but is not guaranteed. Don and Jon Vialoux are Research Analysts with Horizons ETFs Management (Canada) Inc. All of the views expressed herein are the personal views of the authors and are not necessarily the views of Horizons ETFs Management (Canada) Inc., although any of the recommendations found herein may be reflected in positions or transactions in the various client portfolios managed by Horizons ETFs Management (Canada) Inc.
Individual equities mentioned in StockTwits available through EquityClock are not held personally or in HAC.
Horizons Seasonal Rotation ETF HAC July 30th 2014


