by Don Vialoux, Timing the Market
(Jon Vialoux is scheduled to appear on BNN’s Market Call tomorrow at 1:00 PM EDT)
Interesting Charts
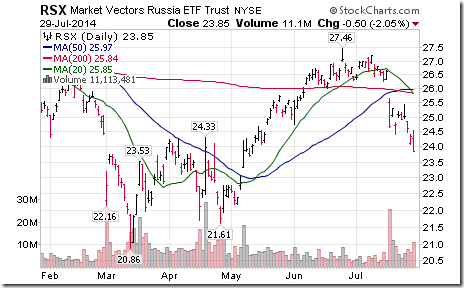
U.S. equity markets continue to respond to international uncertainties (particularly in Ukraine and Palestine). Russian equities are leading on the downside.
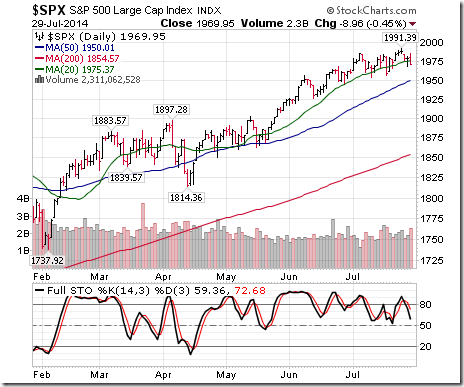
The S&P 500 Index fell below its 20 day moving average. Short term momentum indicators are trending down.
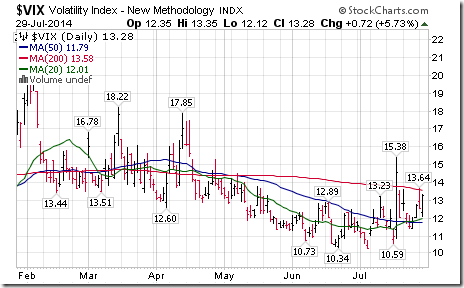
The VIX Index is spiking again.
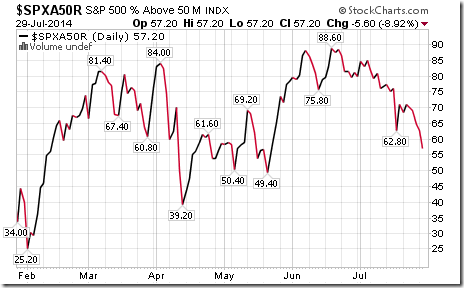
Percent of S&P 500 stocks trading above their 50 day moving average plunged again.
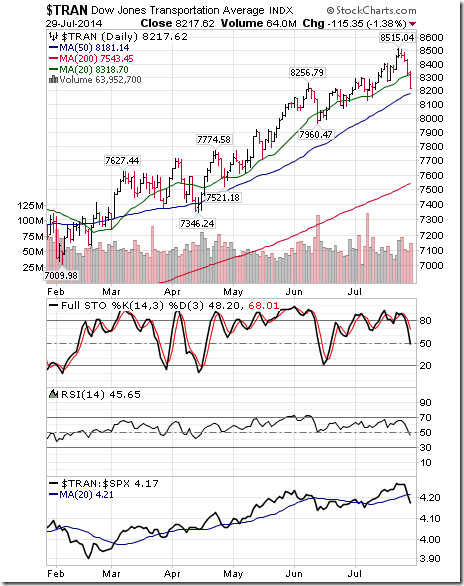
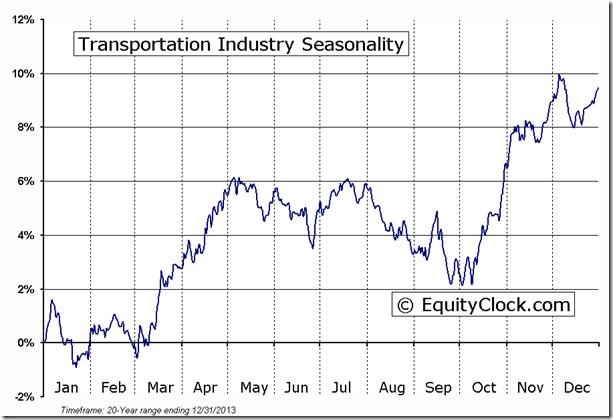
Weakest broadly based U.S. equity index was the Dow Jones Transportation Average. The Average has a heavy influence on the S&P Industrial sector. The Average broke below its 20 day moving average, its strength relative to the S&P 500 Index has turned down and short term momentum indicators have rolled over from an overbought level. ‘Tis the season!
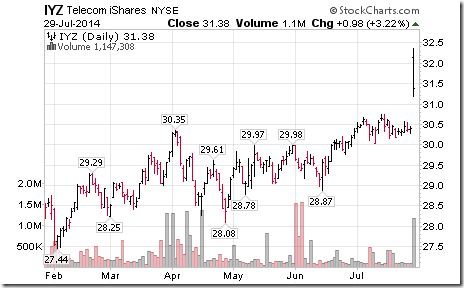
Notable sector moving on the upside was the Telecom sector on news that Windstream intends to spin off some of its telecommunication assets into a REIT. Other major U.S. telecom stocks are expected to follow if Windstream is successful. Net result is a lower tax rate and greater cash flow.
Technical Action in Individual Equities
Technical action by S&P 500 stocks was slightly bearish. Fifteen stocks broke resistance (notably telecom stocks) and 18 stocks broke support. Stocks breaking support were dominated by six Industrial stocks (ETN, EXPD, JEC, MAS, PBI, UPS), a sector that was added to the monitored list on Monday as a Sell/Short.
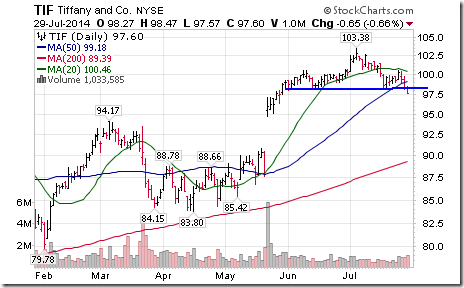
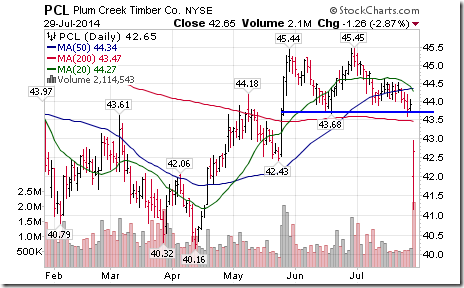
Several stocks completed classic technical patterns. Notable were Tiffany with a head and shoulders patterns and Plum Creek Timber with a double top pattern.
Adding another sector to the monitored list
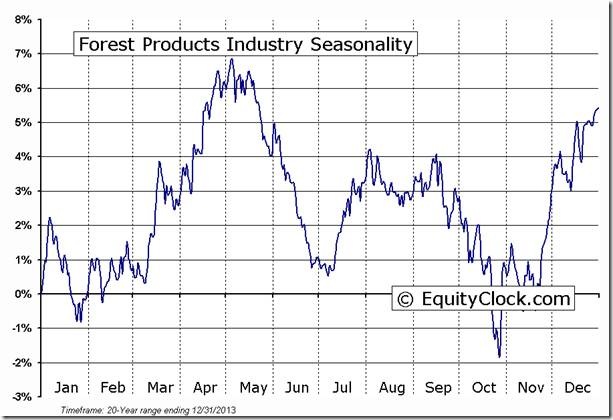
The forest product sector enters into a period of seasonal weakness on a real and relative basis from near the end of July to the end of October.
S5FRST Index Relative to the S&P 500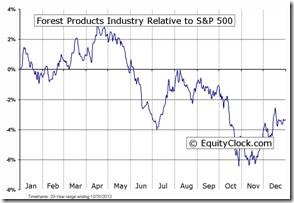 |
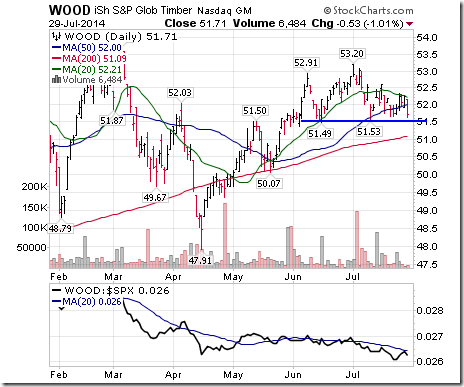
Individual forest product stocks such as Plum CreekTimber have started to break key support levels. Note that the U.S. forest product ETF completes a classic head and shoulders pattern on a break below$51.49. In addition, its strength relative to the S&P 500 is negative and units recently broke below their 20 and 50 day moving averages. Accordingly, WOOD has been added to the Monitored Technical/Seasonal Trade Idea list.
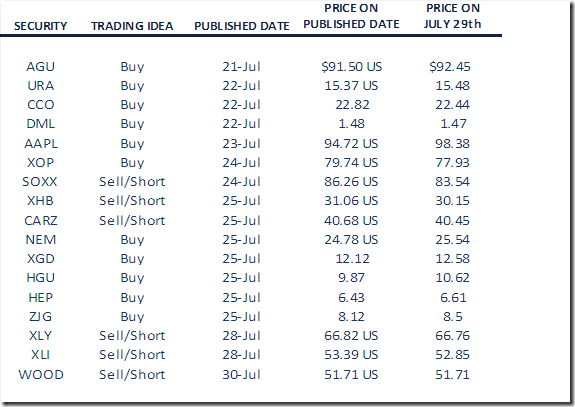
Monitored Technical/Seasonal Trade Ideas
Special Free Services available through www.equityclock.com
Equityclock.com is offering free access to a data base showing seasonal studies on individual stocks and sectors. The data base holds seasonality studies on over 1000 big and moderate cap securities and indices. To login, simply go to http://www.equityclock.com/charts/
Following is an example:
S5TRAN Index Relative to the S&P 500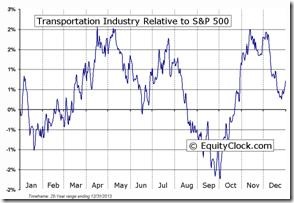 |
S5TRAN Index Relative to the Sector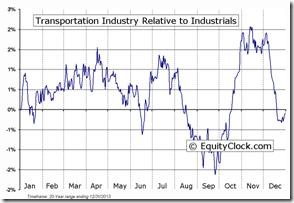 |
Disclaimer: Comments, charts and opinions offered in this report by www.timingthemarket.ca and www.equityclock.com are for information only. They should not be considered as advice to purchase or to sell mentioned securities. Data offered in this report is believed to be accurate, but is not guaranteed. Don and Jon Vialoux are Research Analysts with Horizons ETFs Management (Canada) Inc. All of the views expressed herein are the personal views of the authors and are not necessarily the views of Horizons ETFs Management (Canada) Inc., although any of the recommendations found herein may be reflected in positions or transactions in the various client portfolios managed by Horizons ETFs Management (Canada) Inc.
Individual equities mentioned in StockTwits available through EquityClock are not held personally or in HAC.
Horizons Seasonal Rotation ETF HAC July 29th 2014
Copyright © Don Vialoux, Jon Vialoux, Brooke Thackray


