How High is High? (To Whom?)
by Jeffrey Saut, Chief Investment Strategist, Raymond James
July 21, 2014
I have a number of friends who succeeded as investors in the late 1960s, and they are succeeding now. The key to their success more than 20 years ago was that they managed to get out with most of their capital when the market turned down. Most investors were not so astute.
The name of the game most investors play is momentum and relative strength: Buy the strongest stocks and sell them after they have topped. Occasionally I will ask one of my friends, “How can a rational person pay 60 times earnings and 10 times book value for a growth company with dubious long-term prospects?” The reply: “How high is high? If a stock can sell at 60 times earnings, it can sell at 80 times or 100 times. I don't prejudge anything. I don't look at so called values, I look at price action. If they are going up, I buy them. And if they turn down, I sell them.”
It sounds simple and it is. The only difficulty is that the game has caught on and is being played by an unwieldy number of individuals and institutions. An individual with a few thousand shares in each crazily valued position can get out, but an institution with hundreds of thousands of shares in each position will not be so fortunate. As fast as stock markets go up, they always go down faster. And despite the many trading innovations that have recently been developed, it nevertheless remains difficult to push the proverbial elephant through a keyhole when everyone wants to sell and there aren’t any buyers.
… Frederick E. “Shad” Rowe, Forbes magazine (September 2, 1991)
I recalled those words from my friend Shad Rowe, who is the eagled-eyed captain of the Dallas-based money management firm Greenbrier Partners, as I listened to Janet Yellen's testimony last week. Ms. Yellen was opining that the action in social media and biotech stocks is reminiscent of what Shad was warning about in Forbes magazine 23 years ago. I think his comments, from an era gone by, are just as valid today as they were 23 years ago. In fact, they remind me of a story I heard years ago when I first came into the Wall Street world in 1971.
The story was about a customer who called his broker with a hot stock tip. The customer proceeded to buy several thousand shares of the low-priced “stock tip” and saw it move up. The broker explained that the market was thin and that orders in this stock were hard to execute. Still the customer persisted, ordering his broker to buy more and more stock, even as the price rose. Pleased that the stock was acting so well, the customer went long with the last of his money, completing all of his buy orders; though with some difficulty because his bidding pushed the stock price even higher. Several days later the stock drifted down on light volume, below the customer's last large purchase and threatened to break below his average cost. In a panic, the customer called up and commanded his broker to, “Sell!” “To whom?” the broker asked. “Your buying has been the main factor in pushing the stock higher. There are not enough bids to get you out without breaking the stock substantially below your very first purchase!” So, maybe the better title for our above quote is not “How High is High?” but “To Whom?”
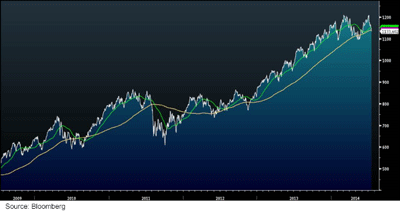
I have followed Shad's lead since he was a contributor to Forbes in the 1970s and 1980s. He has led his firm to outsized performance over the years. His aforementioned 1991 comments resonated with me because a few weeks ago I turned more cautious on a near-term basis following the anticipated rally from the April 15th upside reversal session into the envisioned target zone of 1950 - 1975. Indeed, since June of 2012 we have had a 40%+ rally without so much as a 10% decline. As repeatedly stated, the history of such sequences is that sometime this year we should see a 10% - 12% pullback within the context of a secular bull market that has years left to run. Further, if a stock has failed to rally in the 40%+ rally we have seen since June of 2012, there is likely something wrong. Accordingly, I have suggested raising some cash over the last three weeks. If that “call” proves wrong, we can always redeploy that cash in more favorable situations. This strategy, even if wrong-footed, is in keeping with one of my long-term mantras, “Better to lose face and save skin!” Manifestly, the over-riding theme in investing is captured in this quote from Benjamin Graham's legendary book The Intelligent Investor, “The essence of portfolio management is the management of RISKS, not the management of RETURNS. All good portfolio management begins with this premise.” This is the primary tenant of “Shad’s” investment philosophy, and obviously I agree.
Reinforcing my recent “pullback call” has been the weakness in the Russell 2000 (RUT/1151.61) that looks conspicuously like it has put in a double-top and broken below its 50-day moving average (DMA) at 1152.82, as well as its 200-DMA (@1140.83) on an intraday basis (see chart on next page). However, despite the media's trumpeting of those events, the history of such occurrences is pretty spotty. Year-to-date the S&P 500 (SPX/1978.22) is better by about 7%, but the Russell 2000 is down 0.72%. Such underperformance has caused some pundits to question the health of the overall stock market. However, looking at the history of when the RUT underperforms the SPX shows that more often than not following such a period of underperformance has found the SPX going higher. To be certain, the RUT is trading at about 26x its next 12 months' earnings estimates, while the SPX is trading at 16.6x, so I think all that is happening is a valuation correction in the RUT. In fact, if one looks at all the indices except the large cap ones, it shows that we have indeed fallen into a correction over the past few weeks. Of course that “foots” with the historical trends in that we are now into the 64/65 month timing points since the March 2009 low, which historically has proven to be a trouble spot to the various stock market indices.
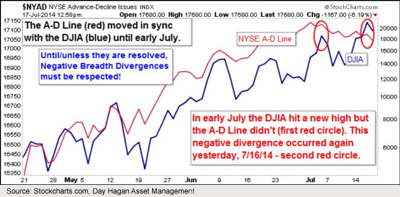
Also counseling for near-term caution are the negative breadth divergences that have occurred this month. The first was in early July and the second happened last week. When the D-J Industrial (INDU/17100.18) makes a new high and the NYSE Advance/Decline Line doesn’t, that's a negative breadth divergence (see chart on page 3). If such a condition is corrected quickly, then the all-clear is signaled. If not, it is a red flag. It has been roughly three weeks since the first divergence and now we have experienced a second divergence. We also have a negative price divergence with the large capitalization indexes acting perky while the small capitalization indices aren’t. When taken in concert with the other warning cracks, I continue to think if I am going to err here, I am going to err on the side of caution.
The call for this week: I have long maintained that the initial support level for the SPX resides between 1940 and 1950. On July 10, 2014 the SPX's intraday low was 1952.86. Last week's intraday low was 1955.59. Accordingly, if those lows are violated, concurrent with a break below the 1940 - 1950 zone, the odds increase for a pullback greater than the mere 6% “hiccups”we have seen since November 2012. Meanwhile, despite all of the negative nabobs of the past few years telling us earnings were NOT going to be up to expectations, last week’s kick-off of earnings season shows 64.2% of earnings reports, and 57.0% of revenue reports, have beaten expectations!
P.S. — This week I am in Nashville at Raymond James' National Conference.
Copyright © Raymond James


