For this week's SIA Equity Leaders Weekly we are going to focus again on the Canadian market due to its strength YTD 2014 by examining two of the three main equity sectors in Canada, specifically the Energy and Financial sectors. Both of these sectors are showing strong relative strength and have contributed to the strong returns of Canadian Equity over the past year.
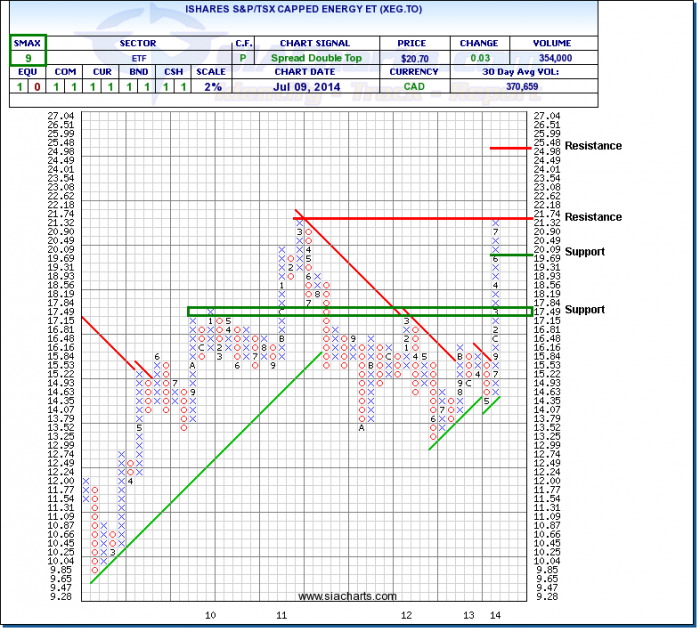
iShares S&P/TSX Capped Energy ETF (XEG.TO)
Looking at the chart of XEG.TO, we can see that it is up 23% YTD 2014 and has broken through the downtrend line in place since 2011. In fact, XEG.TO has not experienced a 3-box reversal on a 2% chart since April 2013 and since that reversal XEG.TO is up over 40%. This is the strongest run without a 3-box reversal in over 10 years. Furthermore, by looking at the S&P/TSX Capped Energy Index we don't see any of the familiar big names in the Favoured Zone such as ARC Resources, Imperial Oil, Suncor Energy, Crescent Point Energy, Cenovus Energy, and Talisman Energy. These names are all in the Unfavoured Zone. The newer up and comers are generating the big returns such as Parex Resources, Raging River Exploration, Bankers Petroleum, etc. Many of these names are up over 50% YTD 2014.
However, XEG.TO is currently sitting on a key resistance level from the multi-year high in 2011. Should it break through this key resistance level its next potential resistance level is at $25.48 which is the all-time high from back in 2008. With an SMAX Score of 9 out of 10, XEG.TO is showing near term strength across all asset classes.
Click on Image to Enlarge
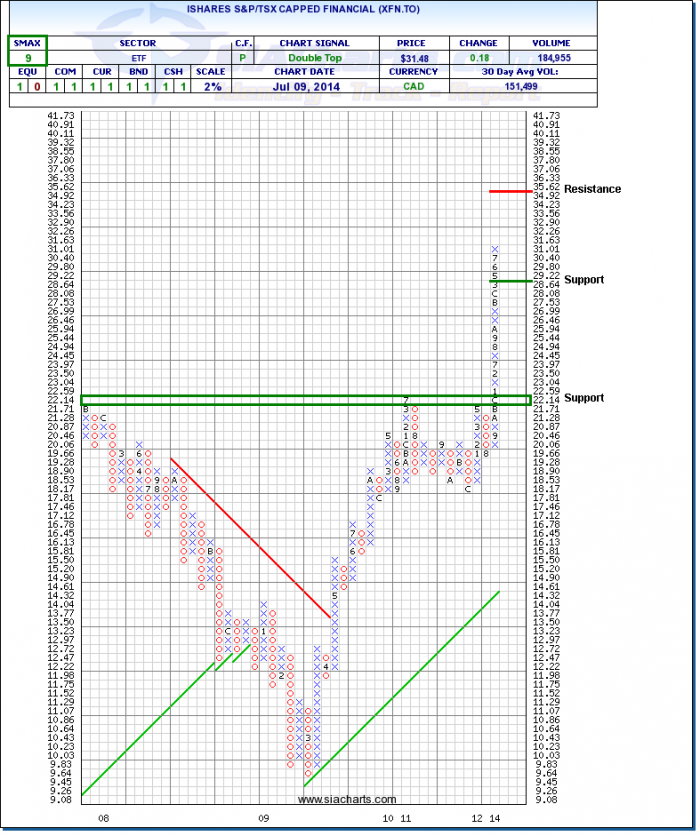
iShares S&P/TSX Capped Financials ETF (XFN.TO)
Looking at the chart of XFN.TO, we can see that it is up 32% since Jan.2013 where it began its move to new all-time highs. In fact, XFN.TO has not experienced a 3-box reversal on a 2% chart since May 2012 and since that reversal XFN.TO is up almost 60%. This is the strongest run without a 3-box reversal since April 2004. Furthermore, by looking at the S&P/TSX Capped Financials Index the only major Bank currently in the Favoured Zone is Royal Bank (RY.TO). Companies like Canaccord Genuity Group, Home Capital Group, Onex Corporation, Canadian Western Bank and Genworth are pushing the group higher. Most of these names are up over 45% over 1 year.
Should this strength continue, its next potential resistance level is at $35.62. To the downside, support can be found at $28.64 and again at the $21 - $22 level which were the highs from 2007 and 2011. With an SMAX Score of 9 out of 10, XFN.TO is showing near term strength across all asset classes.
Click on Image to Enlarge
SIACharts.com specifically represents that it does not give investment advice or advocate the purchase or sale of any security or investment. None of the information contained in this website or document constitutes an offer to sell or the solicitation of an offer to buy any security or other investment or an offer to provide investment services of any kind. Neither SIACharts.com (FundCharts Inc.) nor its third party content providers shall be liable for any errors, inaccuracies or delays in content, or for any actions taken in reliance thereon.
Copyright © SIACharts.com