by Cam Hui, Humble Student of the Markets
Recently, there have been a number of bearish warnings about the equity markets. No doubt there have been signs of froth, but how much frothier can the stock market get? Cutting to the chase, my conclusion is we are seeing the initial stages of a stock market mania and that it will have a lot longer to run. Just as my former colleague Walter Murphy termed "good overbought" to describe overbought conditions in an uptrend, I believe that we are seeing the start of a "good" stock market mania.
But first, let me detail some of the concerns about stock prices.
Long-term valuation warnings
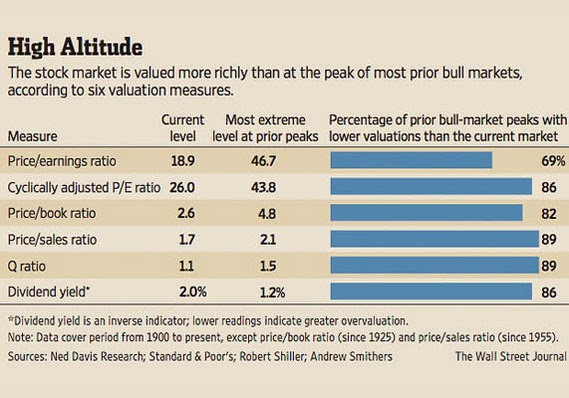
Long-term valuations issues remain front and center. Mark Hulbert echoed many of the problems I raised about US equity valuations as I cited that market PE, PB and dividend yields are elevated (see More evidence of a low return equity environment). Hulbert also highlighted the high levels of other long-term valuation ratios such as CAPE and Q-ratio to make the point that 10-year returns are likely to be disappointing.
I agree with the general conclusion that long-term equity returns are likely to be muted, but does this necessarily mean that stocks go down right away (see "Ending in tears" doesn't mean the market goes down right away). The question is, what is the intermediate term outlook?
Intermediate term red flags
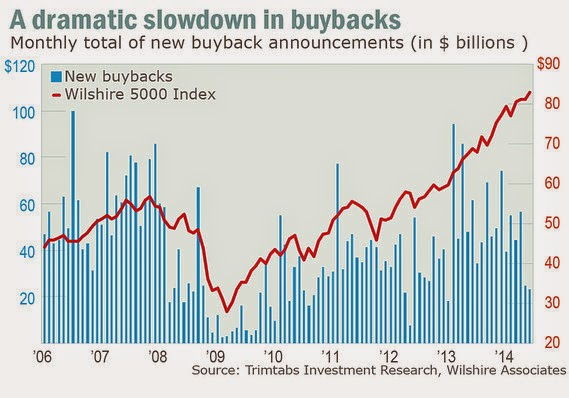
Recently, Mark Hulbert also highlighted some warnings about the intermediate term outlook as well. He cited declining share buybacks and companies using their "expensive" paper to fund acquisitions as signs that the current bull is maturing:
New stock buybacks fell to $23.2 billion in June, the lowest level in a year and a half, according to fund tracker TrimTabs Investment Research. In May, the total was just $24.8 billion, and the monthly average in 2013 was $56 billion.
That’s worrisome, according to TrimTabs CEO David Santschi, because “buyback volume has a high positive correlation with stock prices.”
Corporations recognize that their stock is expensive and, in aggregate, starting to fund acquisitions with their own paper instead of cash, another worrisome sign:
Hedge-fund manager Douglas Kass, president of Seabreeze Partners Management, relates the slowdown in buybacks to the recent M+A wave. He says that both activities represent the implicit recognition by corporate managements that their internal operations are unable to produce sufficient revenue growth to maintain their stock prices.
Over the past five years, for example, per-share sales growth for S+P 500 companies has been an annualized 2.4%, lagging far behind the 20% annualized earnings per share growth rate. One of the ways in which corporate managers have been able to extract that much EPS growth out of such anemic sales growth, Kass argues, is through share repurchases.
As their share prices become more and more inflated, however, corporate managers become increasingly reluctant to buy them. The logical thing to do instead is buy up other companies, paying with shares of their inflated stock.
That’s what is happening now, Kass argues: “There’s a baton exchange from buybacks into M+A activity.”
Regular readers will recognize that I highlighted similar concerns about the combination of falling buyback plans and falling operating margins (see "Ending in tears" doesn't mean the market goes down right away). I am carefully watching the report cards and forward guidance from the current Earnings Season for signs of EPS growth weakness.
CYNK a sign of froth
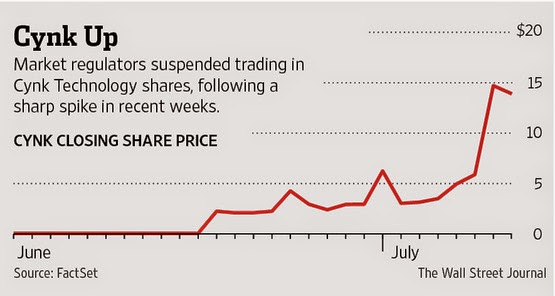
In the very short term, the poster boy for froth has to be the moonshot-like rise of CYNK, a company with no revenues and one employee, which was then suspended and investigated by the SEC for possible manipulation.
Too early to panic
Is this time to sell everything and go to cash? I think that David Merkel had the right perspective when he described the credit cycle in the following fashion:
The credit cycle tends to be like this: in the bull phase, a long period (4-7 years) with few defaults and low loss severity followed by a bear phase, a shorter period (1-3 years) with high defaults and high loss severity. This is a phenomenon where history may not repeat exactly, but it will rhyme very well.
In the bull phase of the credit cycle there are a few defaults, but when you analyze the defaults, they occur for reasons unrelated to the economy as a whole. What do the failures look like? Fraud (think Enron), bad business plans from a megalomanic (think Reliance Insurance, ACH, Southmark, etc.) , a sudden shift in relative prices (think Energy Future Holdings), etc. Bad banking — think Continental Illinois in 1984.
In the bull phase, companies that fail would fail in any environment. But now let’s talk about the transition between the bull and bear phase — that is the “pop, Pop, POP.”
As the credit cycle shifts, a few companies fail that are closely related to the crisis that will come. They are your early warning. Think of the subprime lenders under stress in 2007, or the failure of Bear Stearns in early 2008. Think of LTCM in 1998, or the life insurers that came under stress for writing too many GICs [Guaranteed Investment Contracts] in the late 80s and invested the money in commercial mortgages.
As the cycle moves on defaults become more closely related to the financial economy as a whole. Fed policy is tight, and a bunch of things blow up that borrowed too much money short term. This is when the correlated failures happen.
Right now, Merkel believes that we are starting to see the first "pop" (emphasis added):
The present is always confusing. I get it right more often than most, but not by a large margin. We have companies threatening to fail in China and Portugal, but I don’t see much systemic lending risk in the US yet, aside from what is leftover from the last crisis.
It is worth noting that deleveraging has occurred more in word than in deed over the last five years. Yes, debt has traveled from public to private hands, but that only defers the problems, as governments will either have to inflate, tax more, or default to deal with the additional debts.
I am not trying to sound the alarm here. I am trying to tell you to be ready. During the intermediate phase between bull and bear, the weakest companies fail from unrecognized systemic risk. Personally, I think I have heard the first ‘pop.” It is coming from nations that did not delever, and that may suffer further if the bad debts overwhelm the banking systems.
His advice is to be careful, but it's too early to dive into the foxhole:
Are you ready for the bear phase of the credit cycle? Screen your portfolios, and look for weak names that will not survive a general panic where only the best names can get credit.
I would tend to agree. The kinds of excesses that we are seeing are starting to get worrisome, but they are a natural part of the expansion, where caution gives way to exuberance. I can recall that in the late 1990`s, one of the greatest value of Deutsche Telekom was its valuation and the ability of that company to use its stock for acquisitions. Those excesses did not mark the top of the cycle, but those signs of froth lasted for a couple of years before the market collapsed.
A mania is developing
All of these issues that have been raised - excessive valuation, companies using overvalued paper to fund acquisitions, the kinds of CYNK silliness that show up on occasion are part of a developing mania for risk (see this commentary from Matt Levine about what the more likely story on CYNK was). For this stock market to truly top out, you have to wait for excesses to really, really get out of hand. We are nowhere at that point of the market cycle yet.
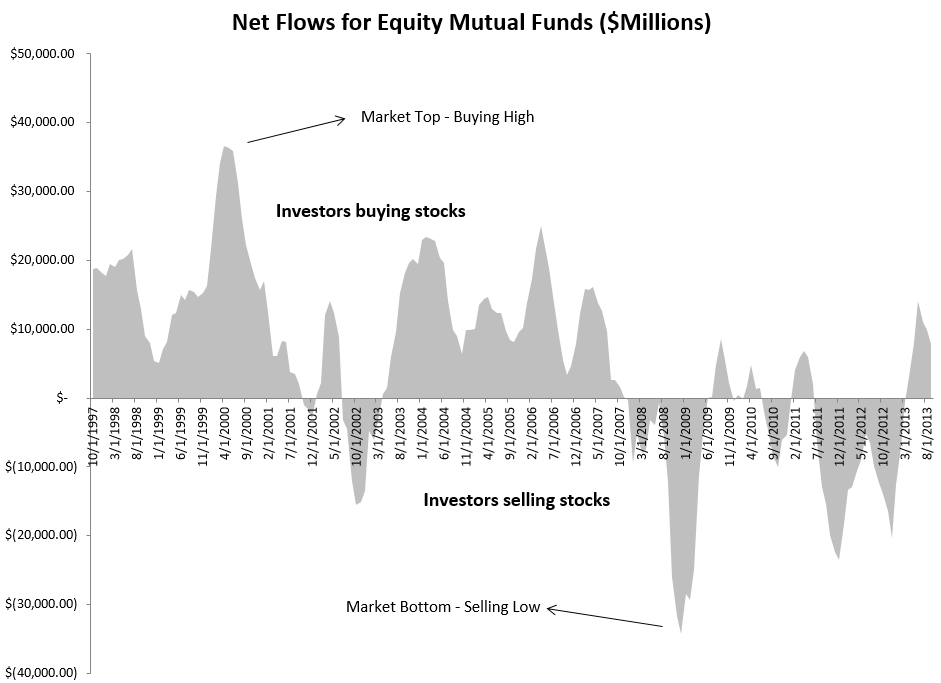
One of signs of a top is the irrational exuberance exhibited by the retail investor. Public (retail) participation is still relatively low and individual investors remain cautious. This chart from Patrick O'Shaughnessy shows that the individual retail investor starting to tiptoe back into equity mutual funds after the devastating sell-off in the wake of the Lehman Crisis, but sentiment can hardly be described at extreme levels.
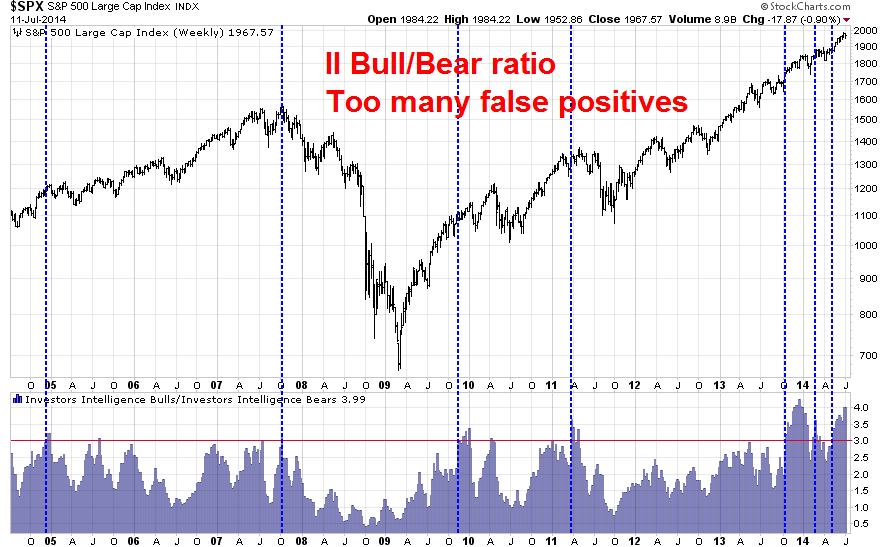
No doubt, I will get emails and comments about the elevated readings from Investors Intelligence, etc. I would note that II polls are opinion polls, which ask newsletter writers their opinions, while hard numbers like mutual fund flows show what people are actually doing with their money. The chart below shows the SPX on the top panel and the II Bull-Bear ratio on the bottom. The vertical lines show the instances where the bull-bear ratio has risen above 3, indicating a crowded long. As the chart shows, while this indicator has shown some value, it has also flashed too many false positives to be useful as an effective market timing tool.
Remember - opinions can change on a dime, but asset allocations generally do not. Actions speak louder than words when it comes to sentiment analysis.
Indeed, the AAII weekly sentiment poll paints a picture of a highly jittery public. While the bull and bear sentiment readings have been volatile, they have been relatively low compared to the level of neutral (read: unsure) opinions, which indicate a high level of uncertainty. This comment from Bespoke hit the mark on the issue of public sentiment (emphasis added):
While bullish sentiment only saw a small decline, bearish sentiment spiked to 28.65% from 22.39%. This was the largest one week increase since April 10th. This week's trend in bullish and bearish sentiment readings is a continuation of the trend that has been in place for much of this bull market. Individual investors are slow to embrace the bull, but at the first signs of trouble are quick to exit.
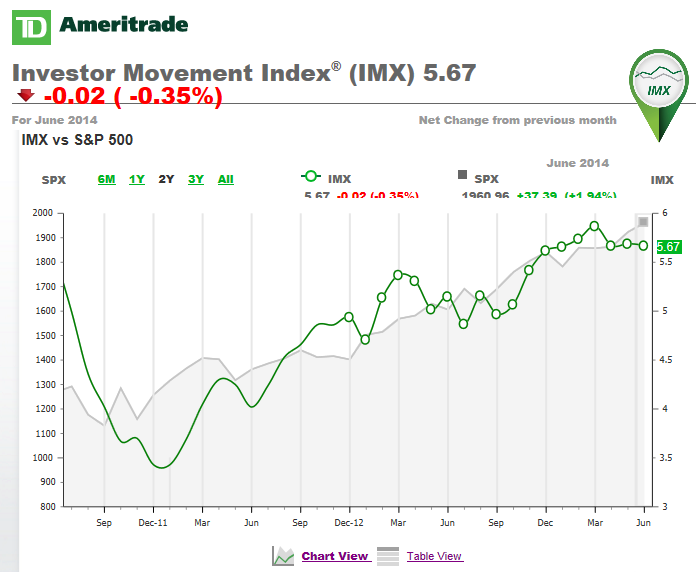
By contrast, the TD-Ameritrade IMX Index, which tracks what TD-Ameritrade customers are actually doing with their money, shows that even as the stock markets advanced to new highs, individual investors have stayed cautious and been slow to embrace the bull:
Funds flow positive
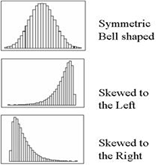
For now, my inner trader remain cautiously bullish. For some time, I have relied on a funds flow model based on this study of skew analysis. The funds flow model measures the skew of the relative returns of equities (SPY) compared to long Treasuries (TLT) and sees what the shape of the distribution looks like.
If the distribution is symmetric (top chart), then funds flows are normal. If it is skewed to the left or right, it would indicate either significant flows into either stocks (risk-on) or bonds (risk-off). Late last week, it flipped bullish indicating funds flow into risky assets. This model does not identify the source of the flows, whether it is retail, institutional or fast money (hedge funds), only that there are significant flows.
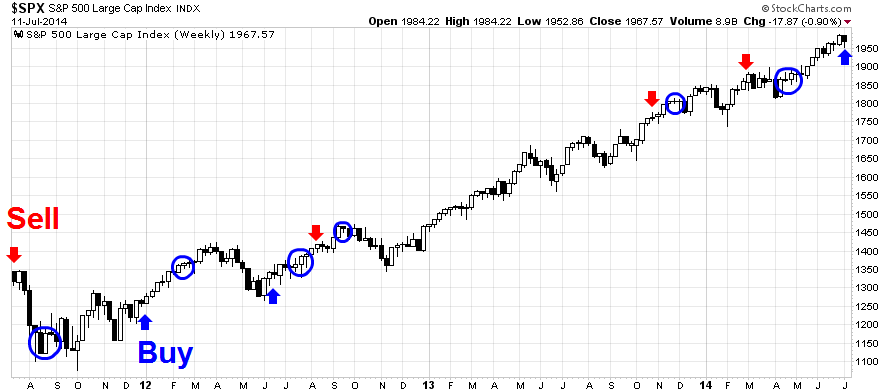
The chart below shows the funds flow model signals in the last three years. Buy signals are marked by blue arrows and sell signals are marked by red arrows. The circles indicate a return to a neutral condition, which would indicate a move to cash signal. Overall, it appears that buy signals have performed better than sell signals:
Key risk: EPS growth scare
In conclusion, the weight of the evidence suggests that intermediate path of least resistance for stock prices is still up. My inner investor is getting somewhat cautious, but he remains long the market. My inner trader believes that the party thrown by the Fed and ECB is just getting going and he is fully enjoying himself.
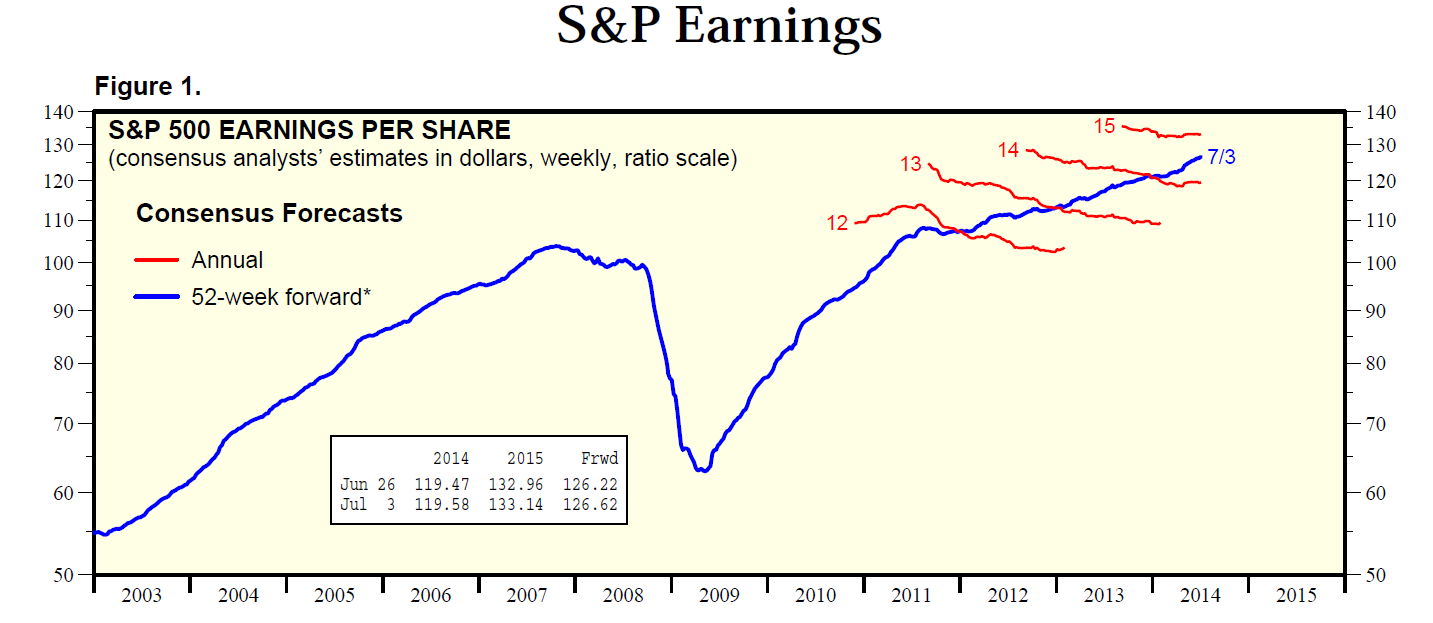
While these conditions suggest that a major bear market is nowhere close to starting, it does not mean that stock prices cannot correct. The one key risk and weak link to the current bull phase is the EPS growth outlook. Analysis from Ed Yardeni shows that Street consensus estimates are still rising, which indicates an equity friendly environment.
However, more recent data from Brian Gilmartin shows that forward EPS growth estimates slipped this week and this is the second week of decelerating growth (emphasis added):
The year-over-year growth rate on the SP 500 slipped to 8.51% from last week’s 8.66%. The y/y growth rate of the forward estimate is still at the higher end of its recent range, and the highest y/y growth rate since 2012.
Recently, I also outlined my concerns that the combination of falling profitability, which affects the numerator in EPS, and declining share buyback plans, which affect the denominator in EPS, are top-down warnings that EPS growth may stall out (see "Ending in tears" doesn't mean the market goes down right away). That's why I believe that the reports from this Earnings Season is so critical to the short-term equity market outlook as these series of earnings reports will serve as a bottom-up verification of that top-down analysis. That's why the earnings reports will bear watching very carefully.
For now, my inner trader is giving the bull case the benefit of the doubt, but he is keeping his stops tight in case we see a series of negative EPS disappointments and guidance.
Copyright © Humble Student of the Markets


