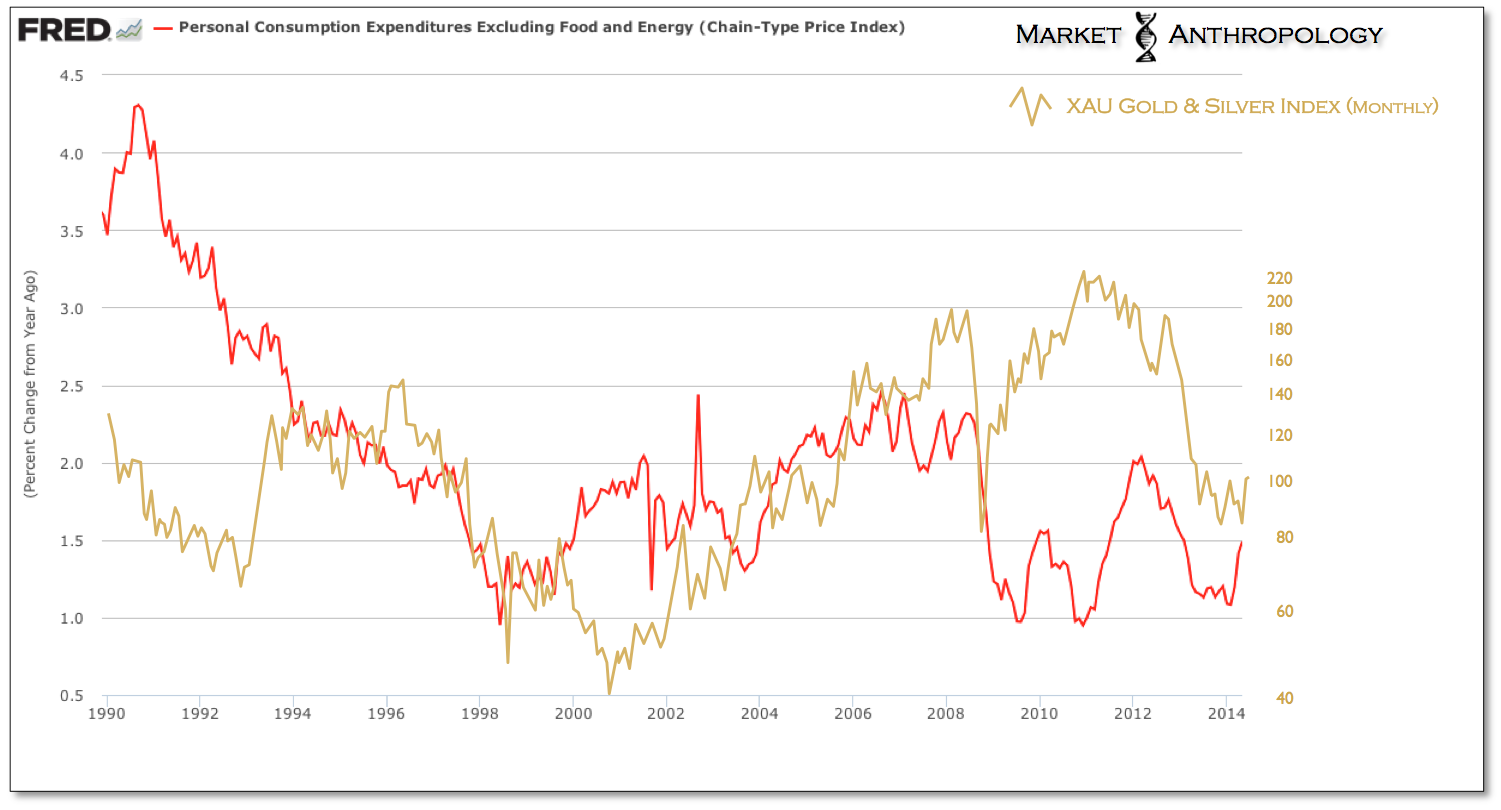
Over the years we've gravitated towards tracking the nuances in the precious metals sector, because they can be great leading indicators of some of the broader changes in the macro climate.
- In 2011, we kept a close eye on silver and the silver:gold ratio, as it shot up its parabolic peak and exhausted in the indiscriminate risk blow-off that culminated at the end of April of that year.
- In 2012, we followed the sector lower as it made a tradable low at the end of Q2, but warned of the comparative differences between QE II and QE III that participants were drawing with the precious metals and commodity markets.
- At the start of 2013, we made the comparison to the value traps of the previous cycle, as their respective miners were leading spot prices and inflation expectations to an eventual capitulation in the sector and the data.
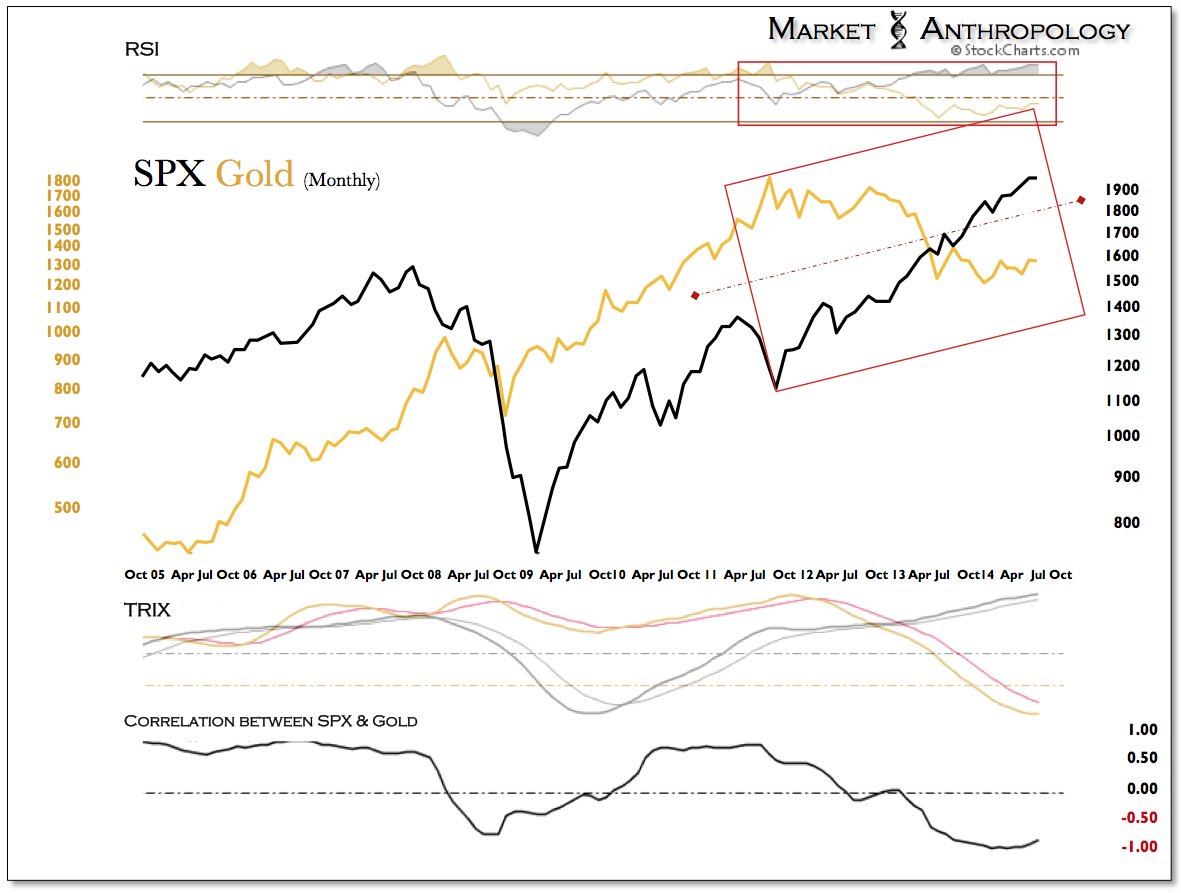
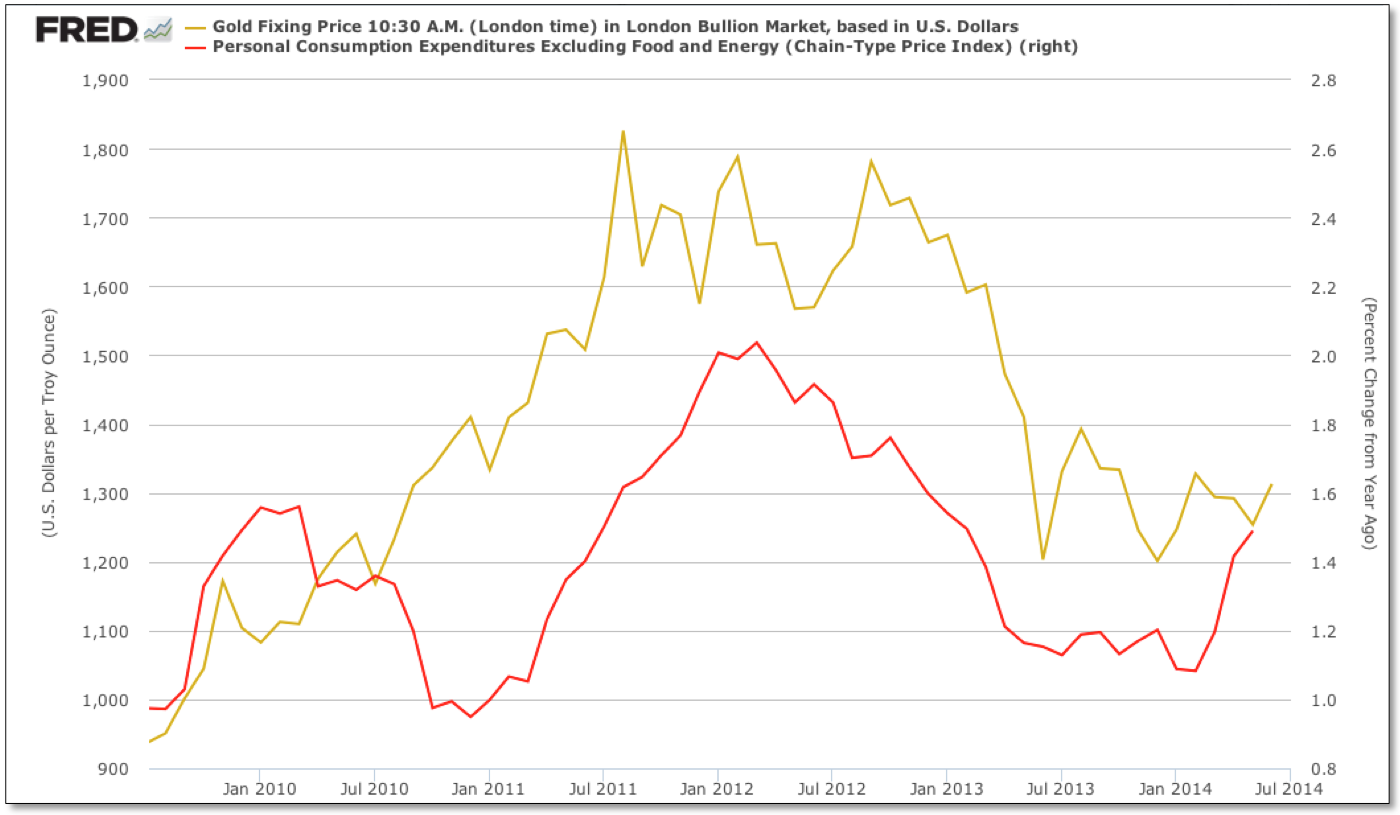 Today, we continue to closely monitor and weigh the precious metals sector as it forges the leading path higher for the broader commodity space and corners of the market that are tangentially influenced with their respective performance and growth trends. Not surprisingly, the pivot higher in precious metals has also been marked with a trend shift north in the inflation data this year.
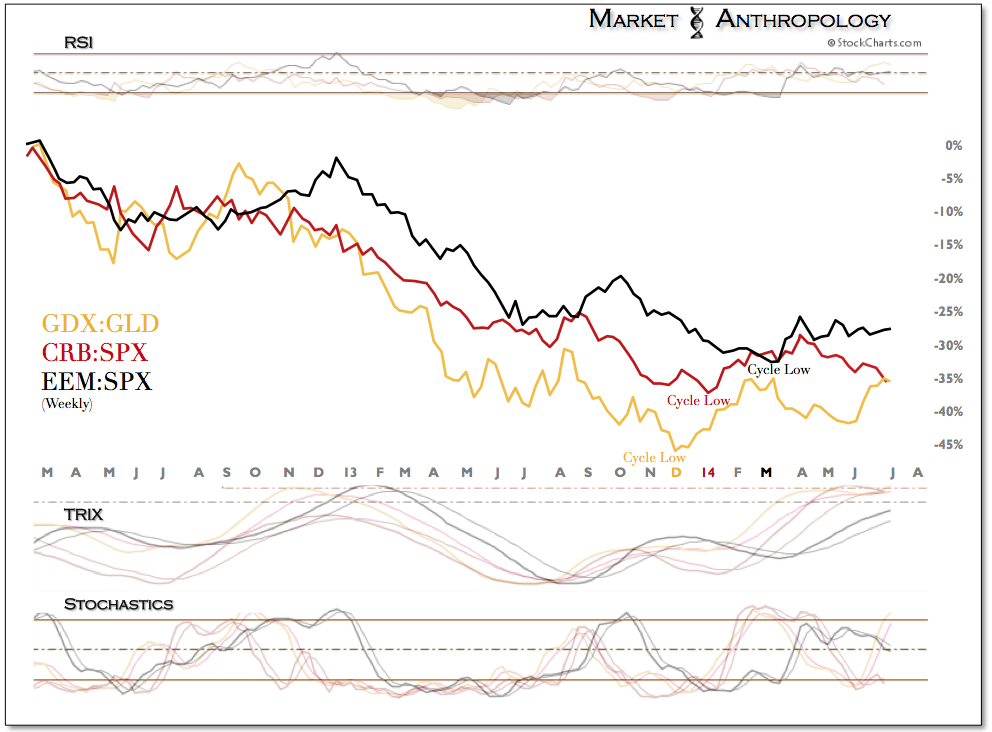
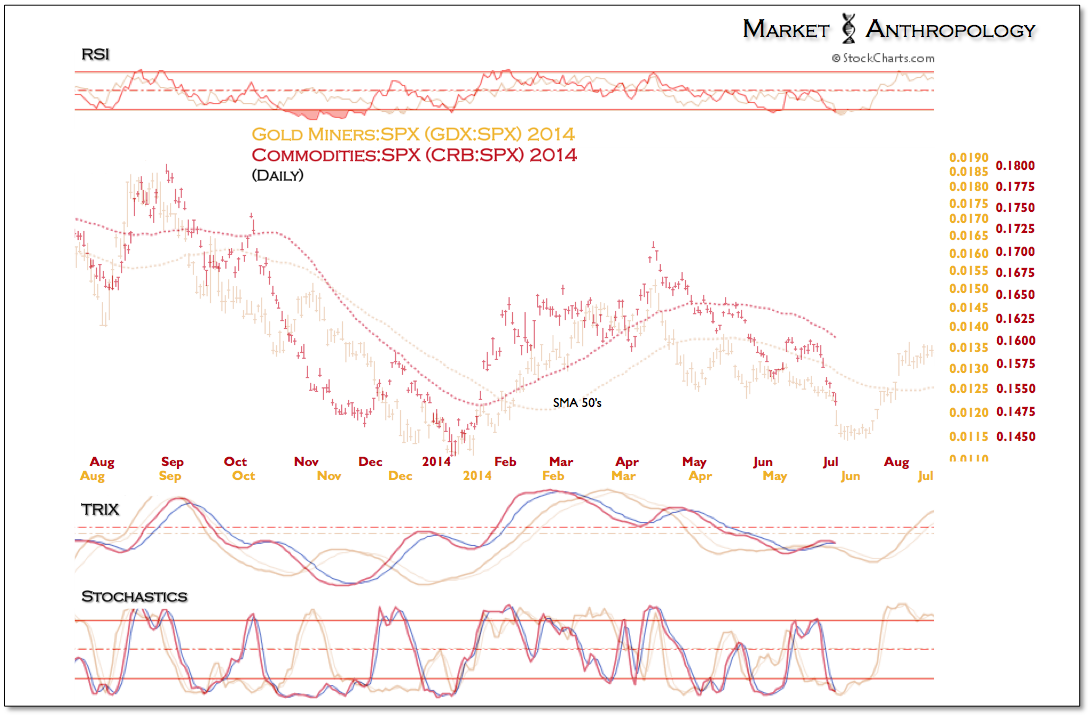
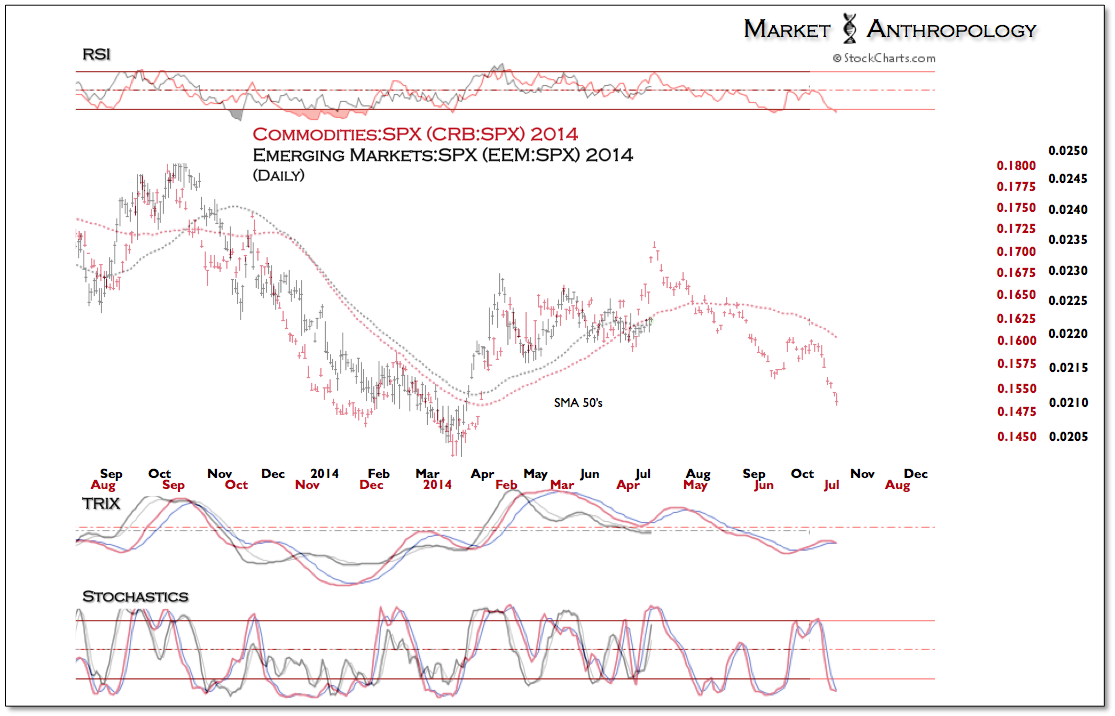
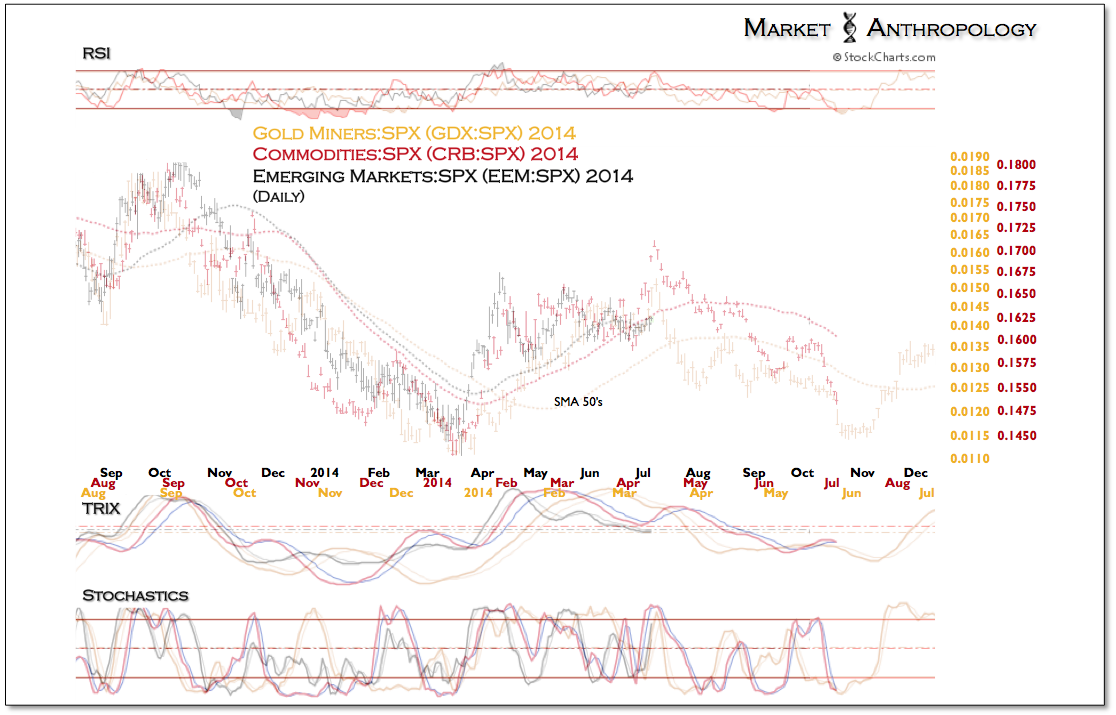
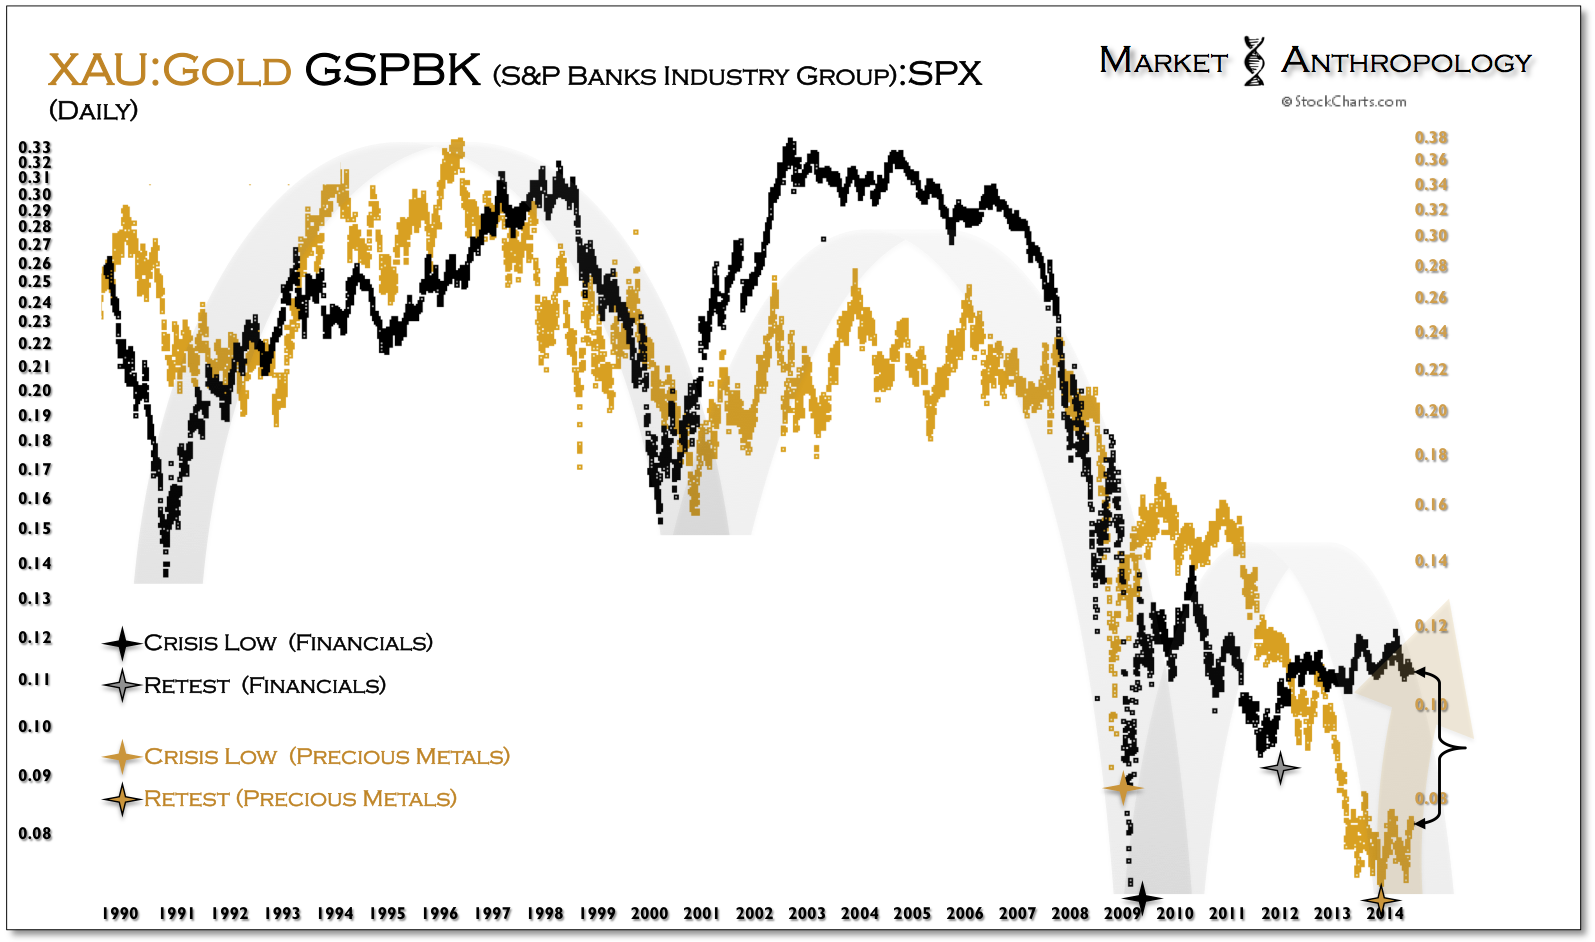
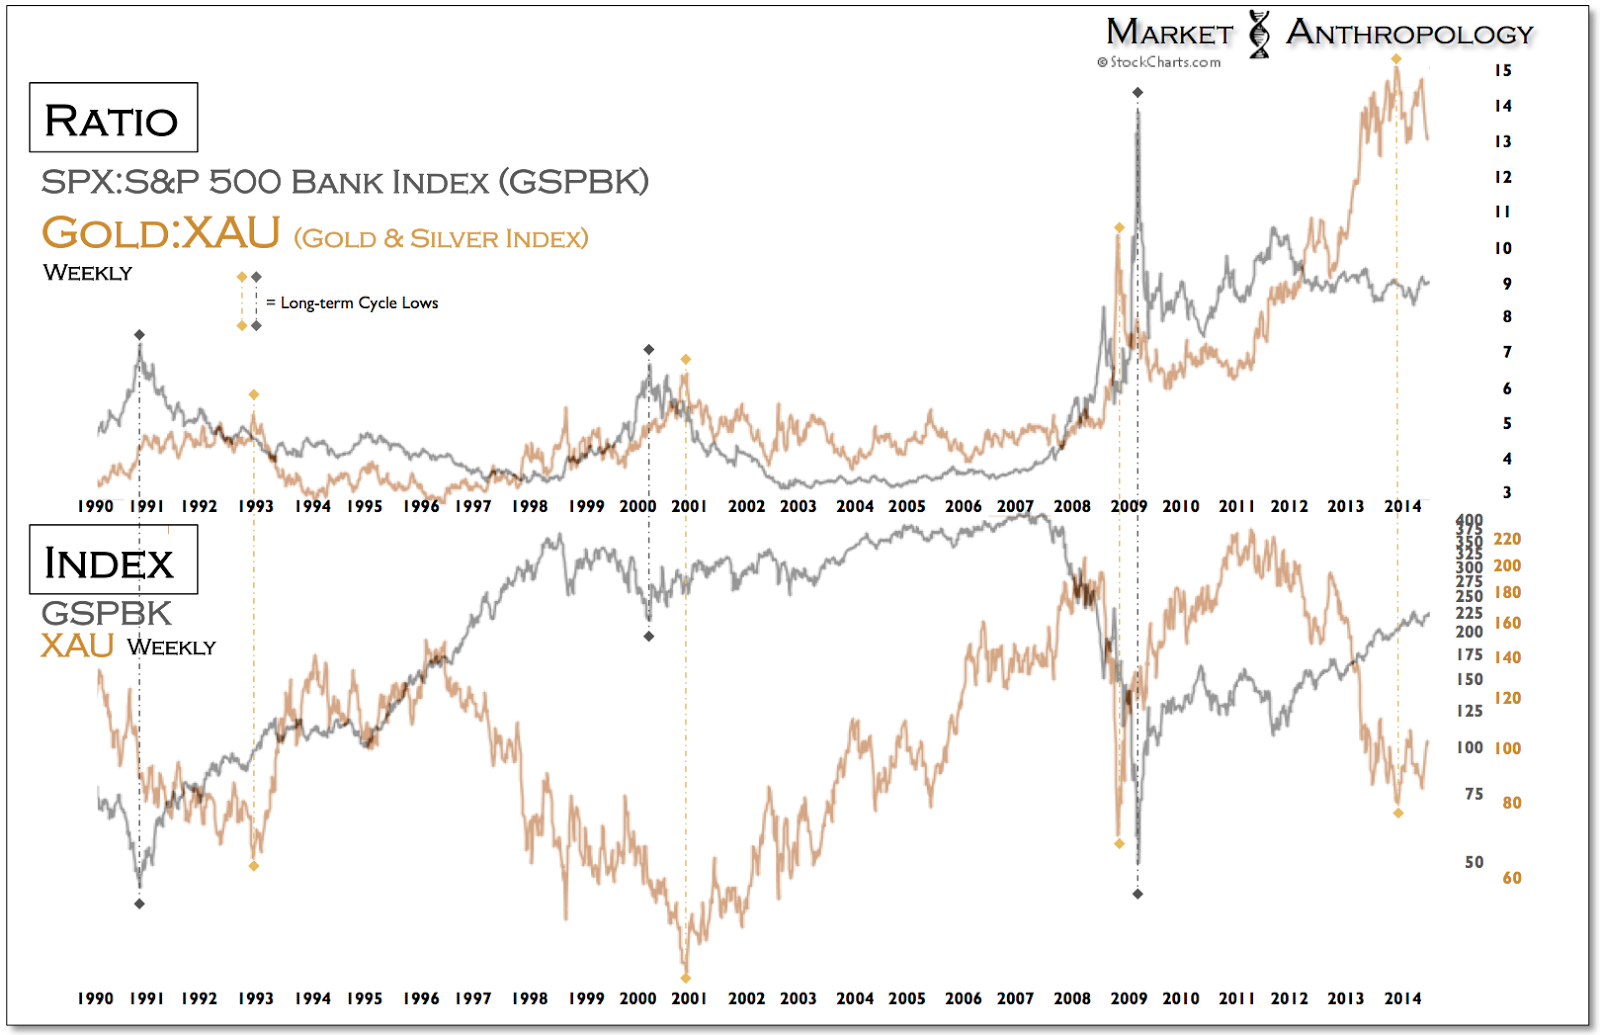
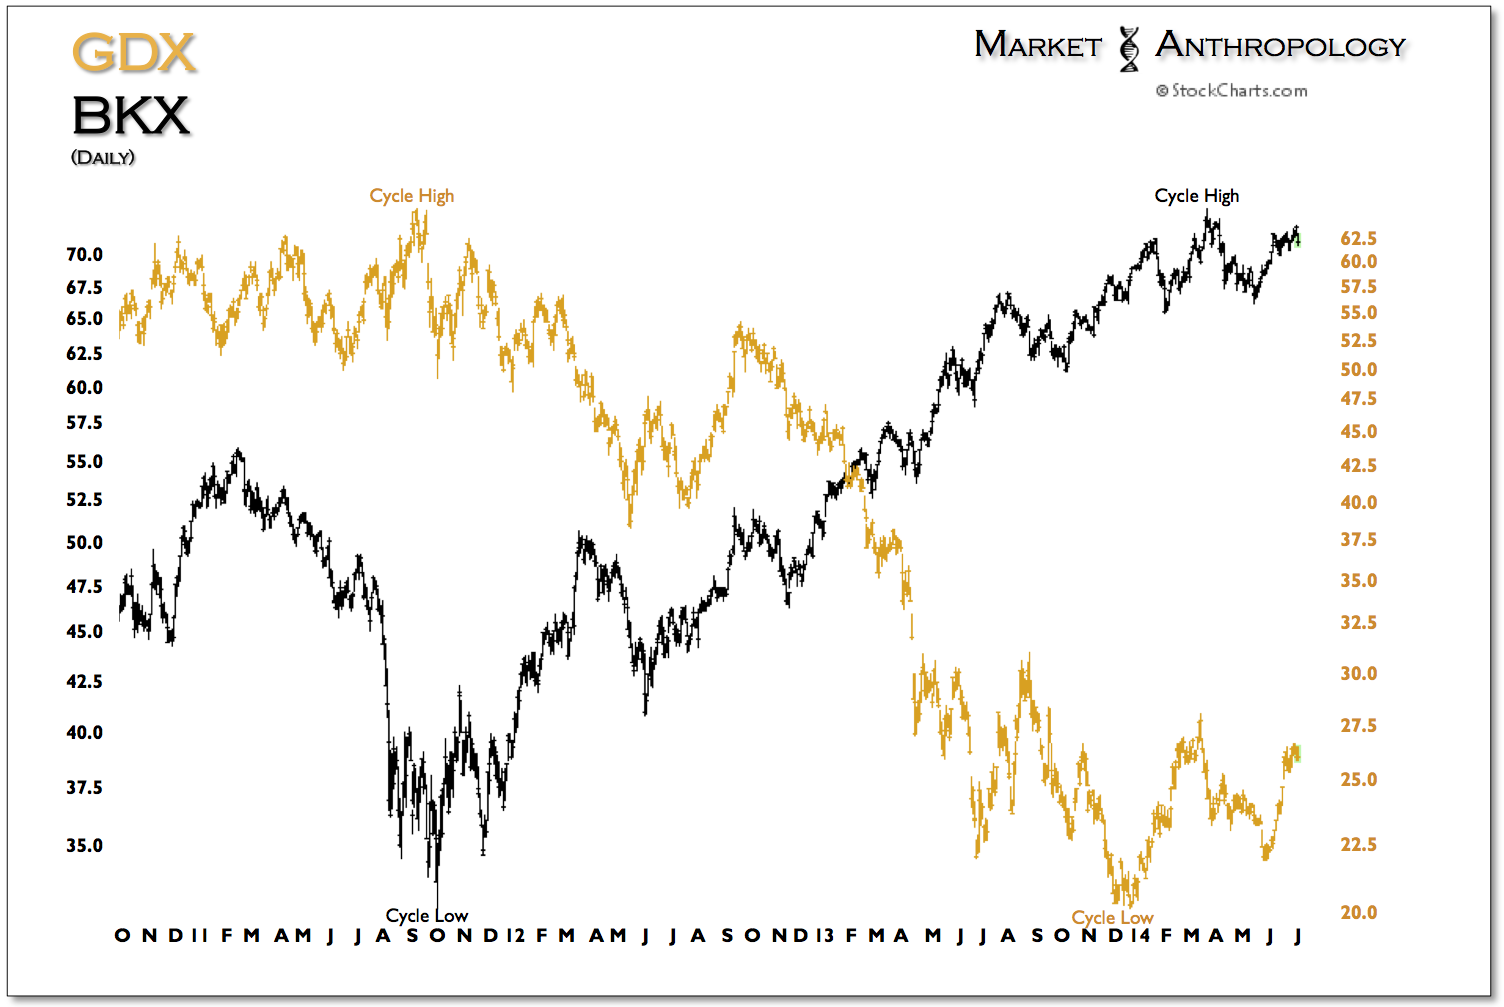
Throughout the year we have followed three risk ratio proxies that have illustrated the staggered start that has developed in the markets as the inflation vane has begun blowing steadily out of the south. Leading the way, the precious metals miners - relative to both spot prices and the SPX, made a cyclical low in December of last year and tested those lows coming into June. Similar to the move in silver, the subsequent rally in the miners has been explosive from their respective support zones.


