by Don Vialoux, Timing the Market
Technical Action Yesterday in Individual Equities
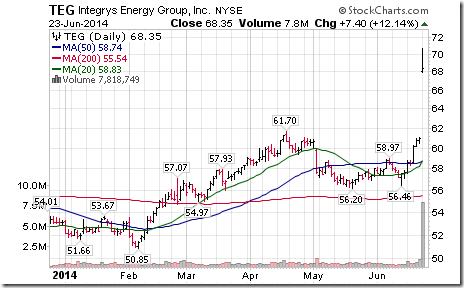
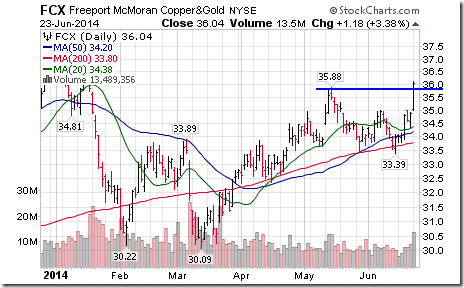
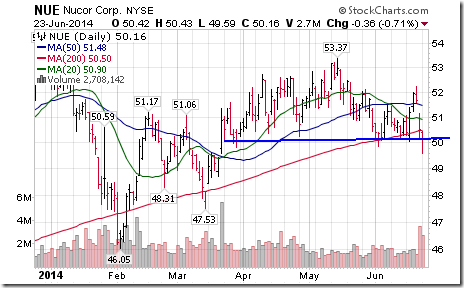
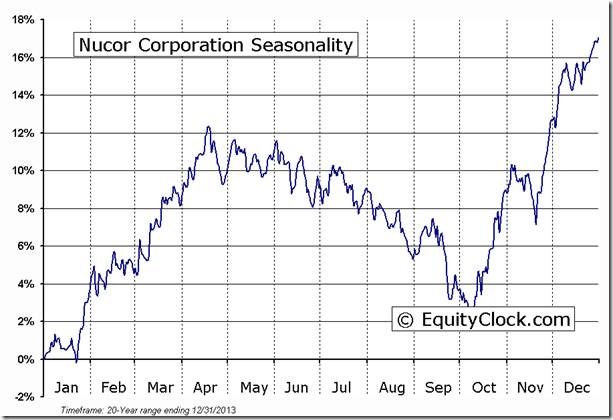
Exceptionally quiet yesterday! Seven S&P 500 stocks broke resistance (PETM, CBG, NDAQ, NLSN, FCX, MON, TEG) and two stocks broke support (NUE, REGN). TEG moved on news of its $5.7 billion takeover by Wisconsin Energy. ‘Tis the season for Nucor to move lower!
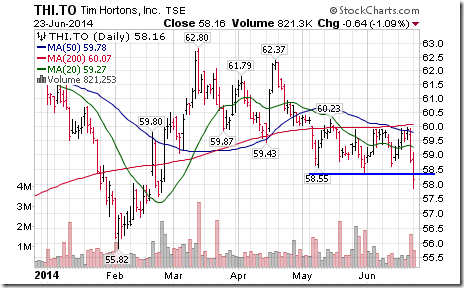
Among TSX 60 stocks, Tim Horton broke support.
Mark Leibovit’s Tutorial on DDD and JJC (copper ETF)
Following is a link:
Editor’s Note: The main reason for the move in FCX was strength in copper prices
Weekly Horizons/Tech Talk Seasonal/Technical Review of Sectors and Markets
Following is a link:
http://www.horizonsetfs.com/campaigns/TechnicalReport/index.html
Adrienne Toghraie’s “Trader’s Coach” Column
|
Flip Flop Trader
By Adrienne Toghraie, Trader’s Coach
Is the best strategy for you the one that is newly being introduced?
When I first started working with traders they were happy to receive information on any one strategy that worked for a trader. They would take that strategy and through trial and error make it their own to be profitable or give up. Now, with all of the strategies available, many traders flip-flop on their trading styles and criteria for entering and exiting a trade. I have especially found this true of want-to-be traders who are members of a trading club and people who want short cuts without investing in their trading profession.
Trading clubs
A trading club is a good place to start learning the lessons of others who are earning profits if you can find these traders there and those who are still struggling. However, if a trader tries to follow the new ideas of every presenter, he will be confused and never earn any profit. People who rely on trading clubs do it because they:
· Do not trust themselves to come up with any viable idea
· Want to share the pain of losing
· Want to brag about what they have earned
· Believe that each next speaker is going to give them the holy-grail of trading
· Want to meet people who have the same interests
· Want to sell something to the other members
Short cut traders
Many beginning traders want to learn their craft through trial and error on their own, because they:
· Do not have the money to spend on a coach
· Do not trust others to teach them
· Do not trust themselves to understand a trader and they do not want to be embarrassed to ask what they feel are dumb questions
· Believe that they can do it themselves without the help of others
· Are too cheap to pay for a teacher
While this has worked for some traders, time should be considered in the equation of cost. It has been my experience that most short cut traders wind up spending a great deal of time trying to learn how to trade and very often lose a great deal of money in the process.
Veteran of a trading club
Brad liked to brag that he was the longest standing member of a trading club. When I spoke at this particular club for a second time after 10 years, Brad came up to greet me and remind me of our first meeting. He was still not earning any money from trading.
I came to learn from one of the newer members that Brad was a fairly wealthy man as a result of an inheritance. With each new speaker he would feel that he had a new insight of what it took to be a top trader. His enthusiasm was infectious and he made speakers feel that they were very special. He invested in all of the speaker’s books, but he never seemed to learn over the years that he could not gain any knowledge from them unless he opened the cover and actually read the books. Brad was always there at the dinner that would follow a meeting picking the brains of the speaker to find out the secrets of their trading success.
Conclusion
The average trader who earns a profit in trading takes at least 3 years to become a professional trader. Consider what time, aggravation, and losses mean to you and then decide if you are going to stick to one good idea. For most traders it is easier to seek assistance by acquiring professional help. This is the only way to cut the learning and profit curve to become a professional trader in less time and effort.
Adrienne’s Free Webinars
Adrienne presents free webinars on the psychology of trading
Email Adrienne@TradingOnTarget.com
Special Free Services available through www.equityclock.com
Equityclock.com is offering free access to a data base showing seasonal studies on individual stocks and sectors. The data base holds seasonality studies on over 1000 big and moderate cap securities and indices. To login, simply go to http://www.equityclock.com/charts/
Following is an example:
NUE Relative to the S&P 500 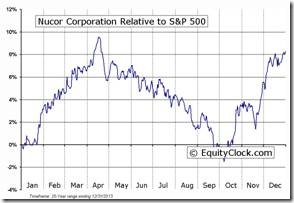 |
NUE Relative to the Sector 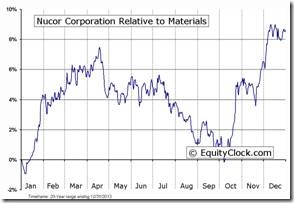 |
INVESTMENT COMMENTARY
Tuesday, June 24, 2014
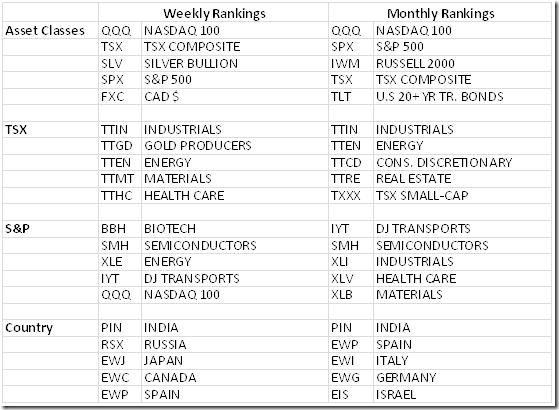
TOP ASSET 5 CLASSES, SECTORS AND COUNTRY HEAT MAPPING
Comment
There is no change in the monthly heat mapping until July 1st.
On the weeklies we’ve seen a rotation to the pro-cyclical and “risk-on” securities. Of note this week is the rise up the rankings of gold producers and, silver and gold (not shown, just outside the top 5 we show here) bullion. A period of historical seasonal strength begins in mid-July. This positive action now comes a little early. Energy too continues to show strength ahead of its strong period in late July. Price action in both groups suggests now that an weakness will be bought
CHARTS of the WEEK
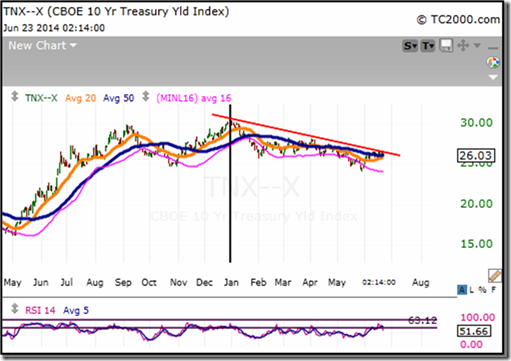
Long Bonds
Last week highlighted a long term chart in bonds which showed a 30 year bull trend. This chart is an intermediate (3 months to 2 years) one. The red line shows yields hitting near term resistance. More significant is the apparent topping process since June of last year. A break of the lows on October 2013 and May 2014 ushers in 1.6% on the US 10yr
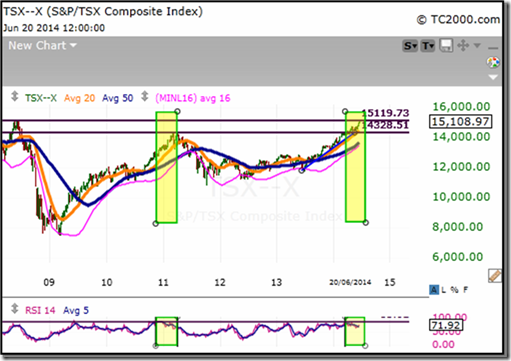
TSX Composite
This mid-term view of the TSX shows the market hitting a resistance last seen in May 2008 at the 15,100 level. A weekly and particularly a monthly, close above this area will allow for next resistance around 16,100.
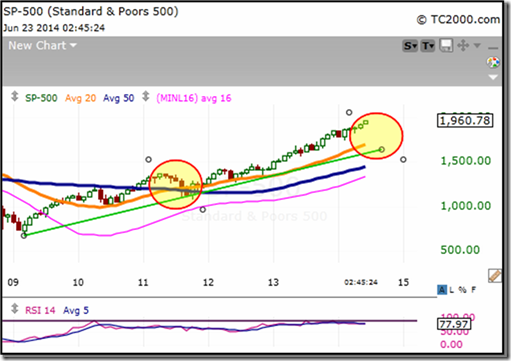
S&P
The S&P is currently riding some high readings on several oscillators such as RSI shown in the lower panel. The nature of markets and its constituent players makes mean reversion, alone, a poor timing tool. Markets may have extreme readings for extended periods of time without any expected move in prices.
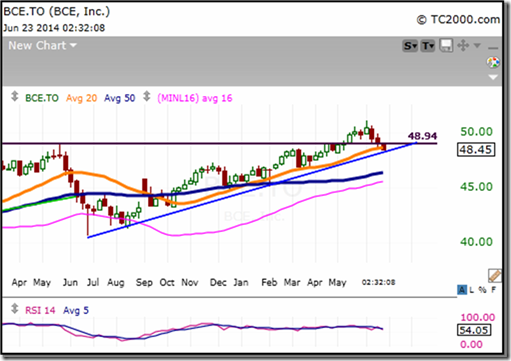
BCE Inc.
BCE, a core client portfolio holding, has been showing weakness in late spring. Only a break of longer term support near 46 would cause us to re-evaluate this stable stock.
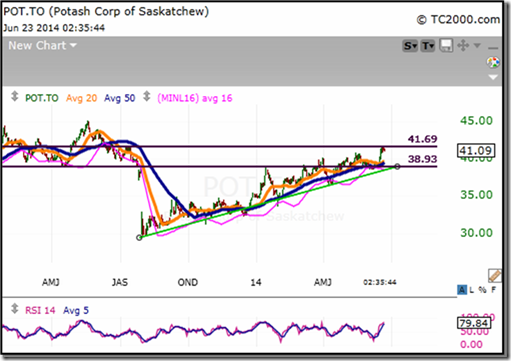
Potash Corp of Saskatchewan
Potash is up some 40% since a low last July, and this was done on the back of lower potash prices after a crazy move by Urkrali (Russia likes drama) to pull out of the cartel. I am not sure its desire to gain market share by volume has been beneficial. Potash has a strong seasonal run into late August. This client holding has strong support at $38.90
If you would like to receive our bi-monthly newsletter, know more about our model portfolios or have a question about what we’ve written please send us an e-mail to info@castlemoore.com We will respond by the end of the business day.
CastleMoore Inc. uses a proprietary Risk/Reward Matrix that places clients with minimum portfolios of $500,000 within one of 12 discretionary portfolios based on risk tolerance, investment objectives, income, net worth and investing experience. For more information on our methodology please contact us.
Buy, Hold…and Know When to Sell
This commentary is not to be considered as offering investment advice on any particular security or market. Please consult a professional or if you invest on your own do your homework and get a good plan, before risking any of your hard earned money. The information provided in CastleMoore Investment Commentary or News, a publication for clients and friends of CastleMoore Inc., is intended to provide a broad look at investing wisdom, and in particular, investment methodologies or techniques. We avoid recommending specific securities due to the inherent risk any one security poses to ones’ overall investment success. Our advice to our clients is based on their risk tolerance, investment objectives, previous market experience, net worth and current income. Please contact CastleMoore Inc. if you require further clarification on this disclaimer.
Disclaimer: Comments, charts and opinions offered in this report by www.timingthemarket.ca and www.equityclock.com are for information only. They should not be considered as advice to purchase or to sell mentioned securities. Data offered in this report is believed to be accurate, but is not guaranteed. Don and Jon Vialoux are Research Analysts with Horizons ETFs Management (Canada) Inc. All of the views expressed herein are the personal views of the authors and are not necessarily the views of Horizons ETFs Management (Canada) Inc., although any of the recommendations found herein may be reflected in positions or transactions in the various client portfolios managed by Horizons ETFs Management (Canada) Inc.
Individual equities mentioned in StockTwits are not held personally or in HAC.
Horizons Seasonal Rotation ETF HAC June 23rd 2014
Copyright © Don Vialoux, Jon Vialoux, Brooke Thackray


