by Don Vialoux, Timing the Market
Pre-opening Comments for Tuesday June 17th
U.S. equity index futures were lower this morning. S&P 500 futures were down 2 points in pre-opening trade.
Index futures weakened following release of economic news at 8:30 AM EDT. Consensus for May Consumer Prices was an increase of 0.2% versus a gain of 0.3% in April. Actual was an increase of 0.4%. Excluding food and energy, consensus for May CPI was an increase of 0.2% versus a gain of 0.2% in April. Actual was an increase of 0.3%. Consensus for May Housing Starts was 1,033,000 versus 1,072,000 in April. Actual was 1,000,000.
Medtronic gained $1.60 to $61.63 after Morgan Stanley, RBC Capital and Credit Suisse upgraded the stock.
Travelers fell $0.97 to $94.49 after BMO Capital downgraded the stock from Outperform to Market Perform. Target is $98.
EquityClock.com’s Daily Market Comment
Following is a link:
http://www.equityclock.com/2014/06/17/stock-market-outlook-for-june-17-2014/
Interesting Chart
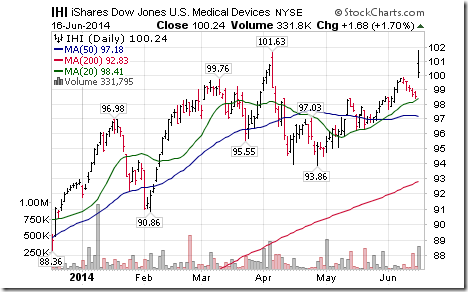
The effective reverse takeover on Covidien by Medtronic triggered significant buying in the Medical Device sector.
Technical Action by Individual Equities
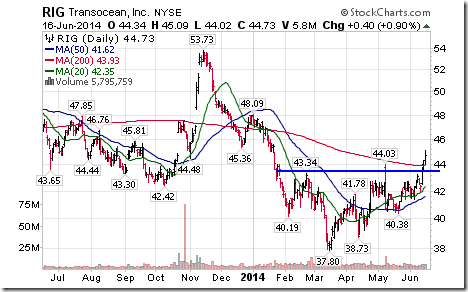
Quiet day by S&P 500 stocks! Five stocks broke resistance (STJ, XLNX, AVY, NU and RIG) and one stock broke support (MDT).
Among TSX 60 stocks, ARX and AEM broke above resistance. None broke support.
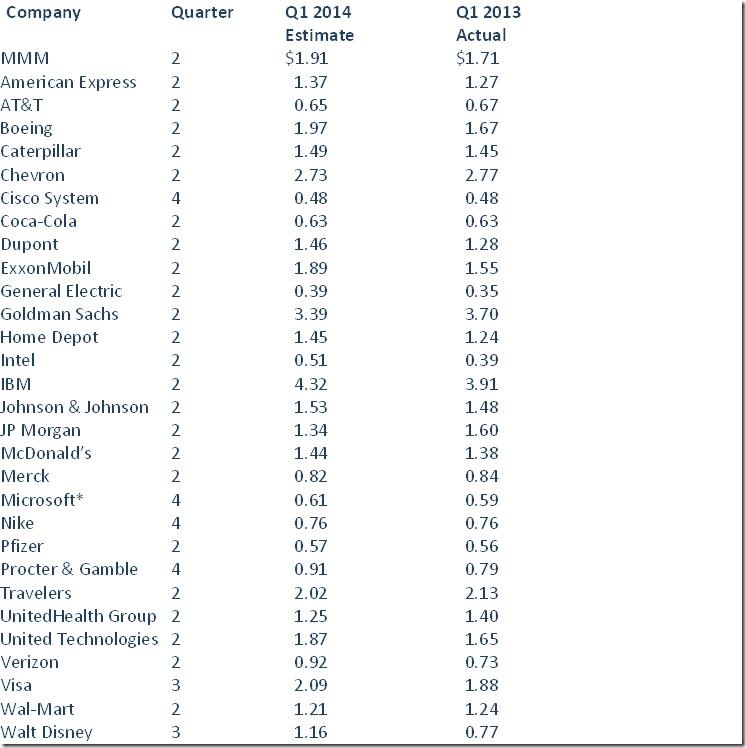
Consensus Second Quarter Earnings per Share Estimates for Dow Jones Industrial Average Companies
Consensus estimates show that year-over-year earnings per share in June will record modest gains. On average (median), earnings will increase 3.4%. Eight DJIA companies are scheduled to report lower earnings, three companies are scheduled to report no change and 19 companies are expected to report higher earnings. Companies expected to report the largest percent gains are Disney, Intel and Verizon. Companies expected to report the largest declines are JP Morgan, Goldman Sachs and United Technologies.
*Median company
Estimates from Zacks Investment Research
Weekly Seasonal/Technical Report on Sectors and Market
(Prepared for Horizons and published yesterday)
Following is a link:
http://www.horizonsetfs.com/campaigns/TechnicalReport/index.html
INVESTMENT COMMENTARY
Tuesday, June 17, 2014
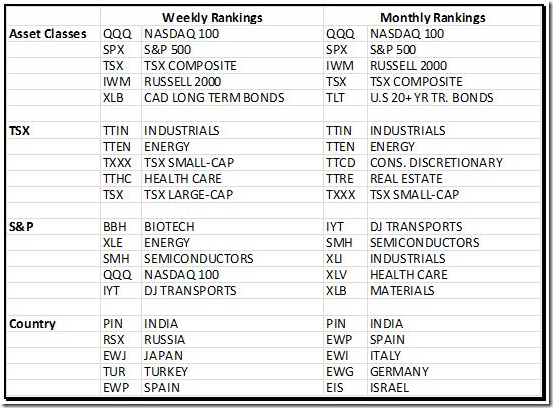
TOP ASSET 5 CLASSES, SECTORS AND COUNTRY HEAT MAPPING
Comment
In the weekly Asset Class rankings the US long bond category fell out of the top 5 and the Russell 2000 came in. Canadian long bonds remained in this shorter term look. The monthlies (right hand columns) will not change until the beginning of July.
In the TSX weeklies Metals & Mining and Real Estate dropped out of the top and Small Cap and Large Cap replaced them.
In the US weeklies Semiconductors replaced Info Tech. All the others remained with slightly different ordering.
And last, in the Country table Japan replaced Russia. All the others remained with slightly different ordering.
Overall, the lack of movement in the heat-mapping reveals a state of complacency in markets.
CHARTS of the WEEK
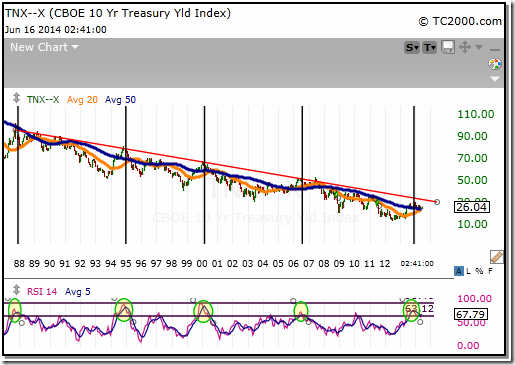
Long Bonds
This long term look at bonds shows upper ranges of yields marked by vertical lines which also correspond to peaks in RSI. At present we are still working off a high reading in the RSI. Disclosure: CastleMoore Focus and Class portfolios contain approximately 30% AAA government long bonds.
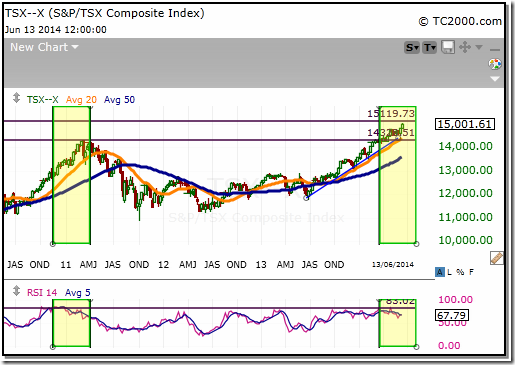
TSX Composite
The TSX is showing signs of peaking. In an intermediate term downtrend in 2011 divergences between RSI and price portended of a market correction.
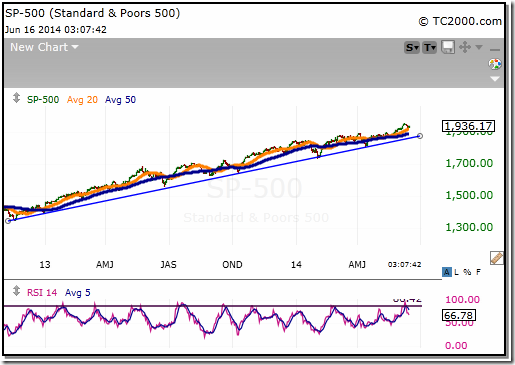
S&P
The S&P remains in an uptrend with little evidence to date of any divergences. Sector rotation has been occurring of late; however, this process may at times bolster the index, preventing it from falling, if the old leaders fall less than the new leaders rise.
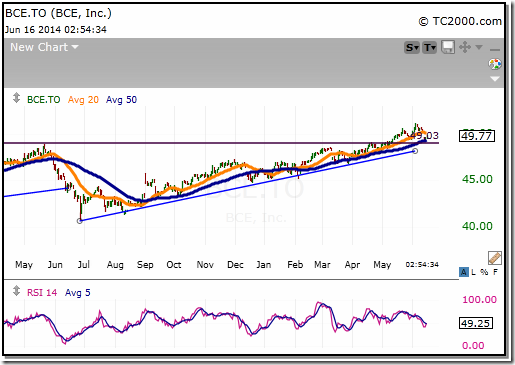
BCE Inc.
BCE as with most Canadian telco’s is showing strength after breaking the peak in 2013. Disclosure: CastleMoore Focus portfolios hold BCE
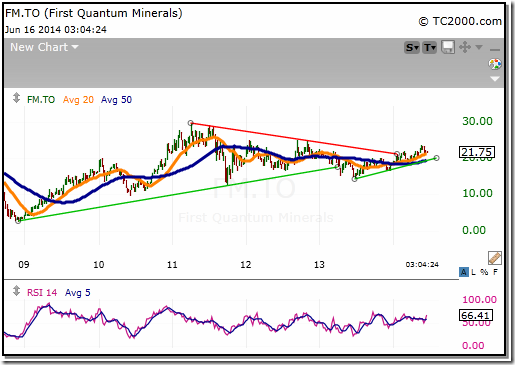
First Quantum Minerals
First Quantum has been a stellar performer since mid-2013, up approximately 54, including dividend. Today it has been showing weakness along with the end of the period of seasonal strength in metals & mining. A 2 x’s ATR stop is close at hand at $20.70. ATR stops may be adjusted tighter (<2x’s) to have a more conservative risk management level.
If you like to receive bi-monthly newsletter, know more about our model portfolios or have a question about what we’ve written please send us an e-mail to info@castlemoore.com We will respond by the end of the business day.
CastleMoore Inc. uses a proprietary Risk/Reward Matrix that places clients with minimum portfolios of $500,000 within one of 12 discretionary portfolios based on risk tolerance, investment objectives, income, net worth and investing experience. For more information on our methodology please contact us.
CastleMoore Inc.
Buy, Hold…and Know When to Sell
This commentary is not to be considered as offering investment advice on any particular security or market. Please consult a professional or if you invest on your own do your homework and get a good plan, before risking any of your hard earned money. The information provided in CastleMoore Investment Commentary or News, a publication for clients and friends of CastleMoore Inc., is intended to provide a broad look at investing wisdom, and in particular, investment methodologies or techniques. We avoid recommending specific securities due to the inherent risk any one security poses to ones’ overall investment success. Our advice to our clients is based on their risk tolerance, investment objectives, previous market experience, net worth and current income. Please contact CastleMoore Inc. if you require further clarification on this disclaimer.
FP Trading Desk Headline
Headline reads, “David Rosenberg: Investor complacency and other things in a bubble”. Following is a link:
Special Free Services available through www.equityclock.com
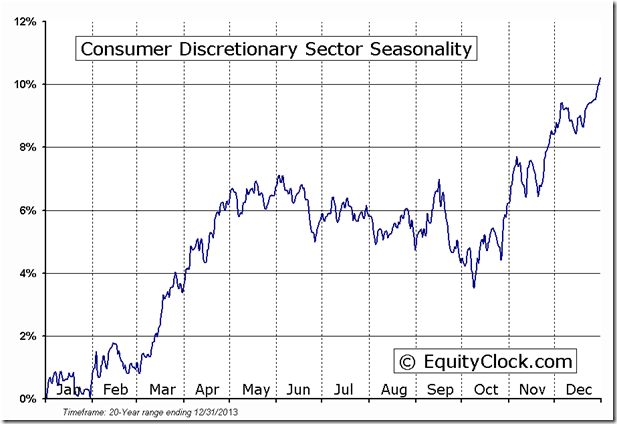
Equityclock.com is offering free access to a data base showing seasonal studies on individual stocks and sectors. The data base holds seasonality studies on over 1000 big and moderate cap securities and indices. To login, simply go to http://www.equityclock.com/charts/
Following is an example:
Mark Leibovit’s video on Tesla
Following is a link:
http://www.youtube.com/watch?v=fKbMEhMv6EM&feature=youtu.be
Disclaimer: Comments, charts and opinions offered in this report by www.timingthemarket.ca and www.equityclock.com are for information only. They should not be considered as advice to purchase or to sell mentioned securities. Data offered in this report is believed to be accurate, but is not guaranteed. Don and Jon Vialoux are Research Analysts with Horizons ETFs Management (Canada) Inc. All of the views expressed herein are the personal views of the authors and are not necessarily the views of Horizons ETFs Management (Canada) Inc., although any of the recommendations found herein may be reflected in positions or transactions in the various client portfolios managed by Horizons ETFs Management (Canada) Inc.
Horizons Seasonal Rotation ETF HAC June 16th 2014
Copyright © Don Vialoux, Jon Vialoux, Brooke Thackray


