by Don Vialoux, Timing the Market
Weekly Horizons/Tech Talk Seasonal/Technical Report
(Published yesterday)
Following is a link:
http://www.horizonsetfs.com/campaigns/TechnicalReport/index.html
Technical Action by Individual Equities Yesterday
Technical action remains bullish. Another 14 S&P 500 stocks broke resistance and one stock broke support (TSN).
Interesting Charts
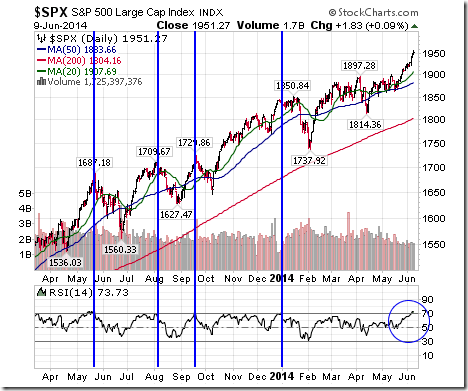
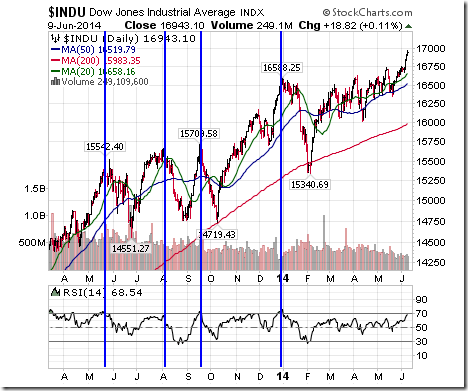
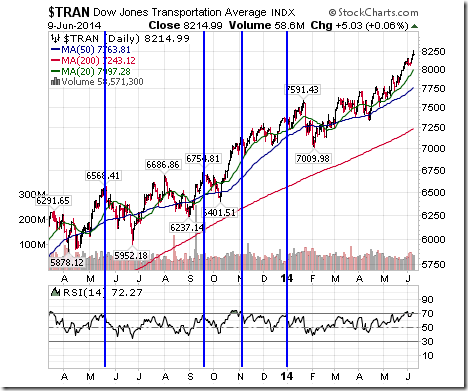
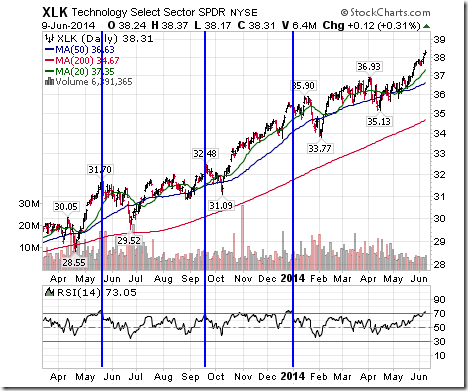
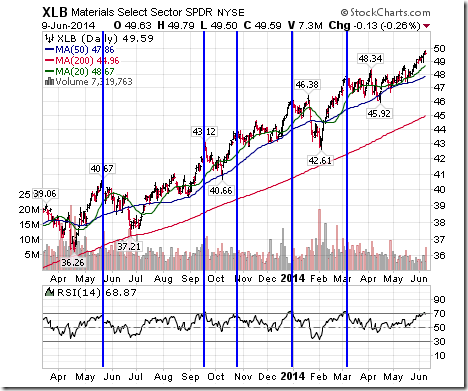
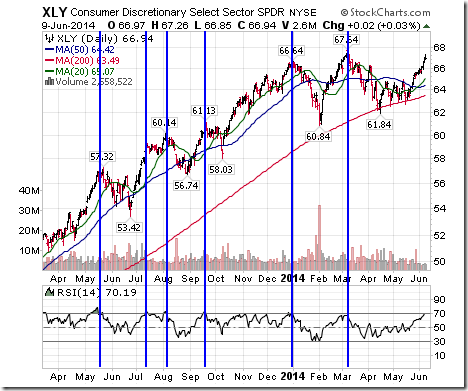
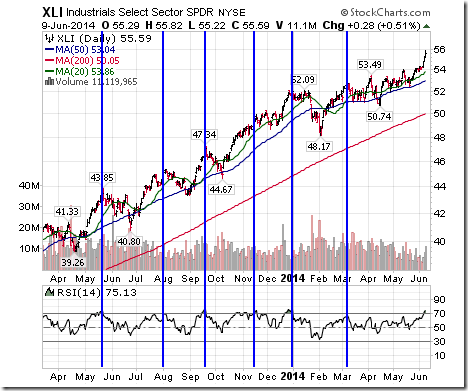
Several key U.S. equity index charts and economic sensitive sectors show an RSI at 70% or higher, a technical level that frequently leads to a short term peak and occasionally to an intermediate correction:
====================================================
INVESTMENT COMMENTARY
Tuesday, June 10, 2014
Comment
Overall within the TSX and S&P stock sector rankings nothing out of the ordinary catches our eye. The sectors performing well should be. There is the expectation that a seasonal rotation should be occurring: the S&P, TSX, Metals & Mining, and the first Energy period are waning, while Biotech, Utilities, Gold and the second Energy period are waxing. While the two groups do not overlap per se there is period of “execution” (buying and selling) overlap. Energy is interesting as it has two periods of seasonal strength. In such a case an investor would expect to see any softness arising from the end of the first period of seasonal strength be quickly bought up. For intermediate term investors, some years the couple month span between seasonal strengths may be held, such as it appears to date, anyway, this year.
And the Country rankings seem be following the macro-economic pictures on both the weekly and monthly basis (7 period). The weakness seen in emerging and peripheral developed markets last spring was bought and led to outperformance now.
To be sure, the most interesting observation is within the Asset Class rankings. US long bonds are in the top on both timeframes, Canadian bonds are in the weeklies and just outside what is shown above in position 6. Preferred shares are just outside the top rankings on both timeframes that we show here as well. True, the seasonal period for bonds is upon us (beginning of May historically), but it would be expected they show up just in the shorter term (weekly) analysis and not in the longer term (monthly) as well. This move may very well be confirmed as a longer one as we head into July and get the advanced GDP numbers. Analysts have been expecting 3% full year GDP. After Q1’s -0.1% we need 3 quarters on 4%+ to stay on such a course.
CHARTS of the WEEK
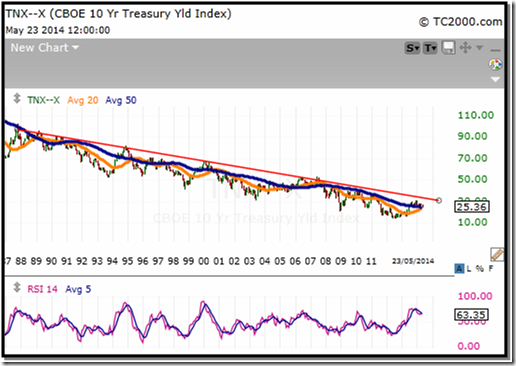
Long Bonds
As mentioned above, bonds are strong with no indication this 30+yr trend is in jeopardy despite what the consensus expects for inflation or growth. A break below 2.4% in the US 10yr Treasury is an important event as us a move above 3%
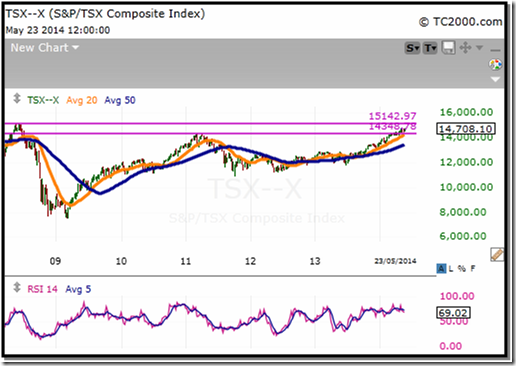
TSX Composite
The TSX is now running into a couple resistance points at around 14,700 (current) and the all-time high at 15,154. Many indicators are overbought.
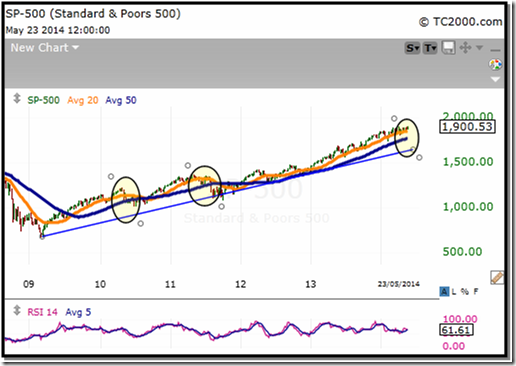
S&P
The S&P underperformed the TSX in Q1. The buy signal that came in mid-April was weak though the market has moved lately in parabolic fashion. The signal has since turned down slightly indicating a “fake out” (not a real signal). Based on support levels buyers would increase the anemic volume and come in around 1870
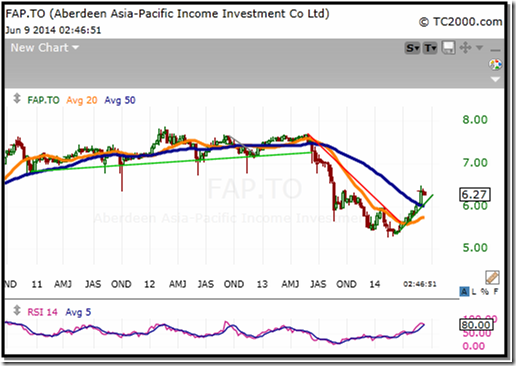
Aberdeen Asia-Pacific Income Investment
In keeping with the bond and developing/emerging market themes this unit contains primarily government (70%) bonds and sovereigns and supranationals (17%). This was a recent Top Pick on BNN Market Call. The reason: strong seasonality, good macro-economic underpinnings, distributions, and most importantly a good risk-to-reward rations from current prices.
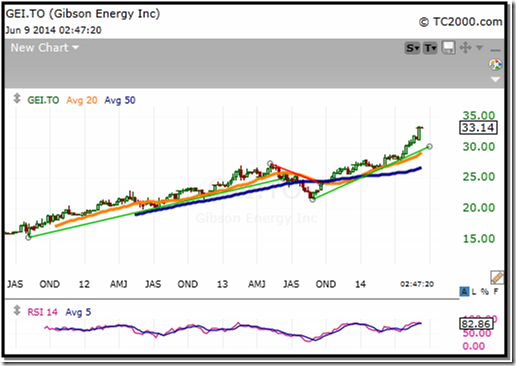
Gibson Energy Inc.
Gibson Energy exploits through its services the differential in price of WTI and Alberta Oil Sand bitumen. Though it is a well-run company and energy has a second impending period of seasonal strength, the technicals are getting extended forcing us to raise the trailing ATR stop from weekly to daily to protect the 44% profit. Periods of seasonal strength for the sector may translate in any given year (shift early or late) based on the broad index characteristic and individual names can very, both of which lead us to preferring to err on the side of protection.
If you like to receive bi-monthly newsletter, know more about our model portfolios or have a question about what we’ve written please send us an e-mail to info@castlemoore.com We will respond by the end of the business day.
CastleMoore Inc. uses a proprietary Risk/Reward Matrix that places clients with minimum portfolios of $500,000 within one of 12 discretionary portfolios based on risk tolerance, investment objectives, income, net worth and investing experience. For more information on our methodology please contact us.
CastleMoore Inc.
Buy, Hold…and Know When to Sell
This commentary is not to be considered as offering investment advice on any particular security or market. Please consult a professional or if you invest on your own do your homework and get a good plan, before risking any of your hard earned money. The information provided in CastleMoore Investment Commentary or News, a publication for clients and friends of CastleMoore Inc., is intended to provide a broad look at investing wisdom, and in particular, investment methodologies or techniques. We avoid recommending specific securities due to the inherent risk any one security poses to ones’ overall investment success. Our advice to our clients is based on their risk tolerance, investment objectives, previous market experience, net worth and current income. Please contact CastleMoore Inc. if you require further clarification on this disclaimer.
====================================================
Special Free Services available through www.equityclock.com
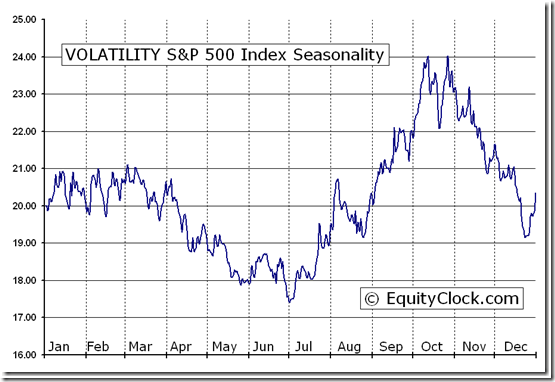
Equityclock.com is offering free access to a data base showing seasonal studies on individual stocks and sectors. The data base holds seasonality studies on over 1000 big and moderate cap securities and indices. To login, simply go to http://www.equityclock.com/charts/
Following is an example:
Disclaimer: Comments, charts and opinions offered in this report by www.timingthemarket.ca and www.equityclock.com are for information only. They should not be considered as advice to purchase or to sell mentioned securities. Data offered in this report is believed to be accurate, but is not guaranteed. Don and Jon Vialoux are Research Analysts with Horizons ETFs Management (Canada) Inc. All of the views expressed herein are the personal views of the authors and are not necessarily the views of Horizons ETFs Management (Canada) Inc., although any of the recommendations found herein may be reflected in positions or transactions in the various client portfolios managed by Horizons ETFs Management (Canada) Inc.
Horizons Seasonal Rotation ETF HAC June 9th 2014
Copyright © Don Vialoux, Jon Vialoux, Brooke Thackray


